Unit 7 · 4 teaching hours · 17 min read
Developing and Justifying Information Systems
What the syllabus asks for 7
- Developing and acquiring information systems
- Costs and benefits
- Payback, NPV, IRR and ROI
- Total cost of ownership (TCO)
- Break-even analysis
- Managing change and ethics
- Seeing investment decisions: cash flows, NPV, TCO and break-even
A hospital wants a new patient-record system. The vendor's quotation is Rs 12,00,000; the manager must answer one question before any programmer is hired: is it worth it? This final unit connects the technical chapters to money.
It first shows how systems are developed and acquired (SDLC, prototyping, build, buy or outsource), then evaluates the investment with the standard measures: payback, NPV, IRR, ROI, total cost of ownership and break-even.
- Development approaches and the build-versus-buy decision; project success factors and risks.
- Cost-benefit analysis: payback, discounted payback, NPV, IRR, profitability index, ROI.
- Total cost of ownership (on-premise versus cloud) and break-even analysis.
- Change management and ethical considerations.
7.1 Developing and acquiring information systems
The systems development life cycle (SDLC): investigation and feasibility, analysis (requirements), design, construction or acquisition, testing, implementation (conversion, training), and maintenance.
(The System Analysis and Design and Software Engineering books treat these in detail.) Alternatives to the sequential waterfall approach: prototyping (build a quick model to clarify requirements), agile (short iterations with working software), end-user development (spreadsheets and no-code tools, with the risk of ungoverned data) and RAD.
Build, buy or outsource?
| Option | Choose when | Advantage | Risk |
|---|---|---|---|
| Build in-house | Unique process that is a source of advantage; skills available | Exact fit, control | Cost, time, key-person risk |
| Buy a package / SaaS | Standard process (accounting, HR) | Fast, proven, lower upfront cost | Fit gaps, vendor dependence |
| Customise a package | Mostly standard, a few special needs | Balance | Upgrades become hard |
| Outsource development or operation | Skills or capacity lacking | Access to expertise | Control, confidentiality, contract lock-in |
Feasibility has five facets: technical (can it be built?), economic (does it pay?), operational (will people use it?), legal (compliance) and schedule.
Projects fail mainly for non-technical reasons: unclear requirements, lack of user involvement, scope creep, weak sponsorship and no change management.
7.2 Costs and benefits
Costs are one-time (hardware, software, development, data migration, training) and recurring (licences or subscriptions, support, staff, power, upgrades).
Benefits are tangible (cash savings, higher revenue, lower inventory) or intangible (better decisions, customer satisfaction, compliance), which should be valued where possible, for example by estimating the cost of the errors avoided.
7.3 Payback, NPV, IRR and ROI
Money received later is worth less than money today, so cash flows are discounted. The present value of a cash flow C received in year t at discount rate r is C / (1 + r)ᵗ.
The net present value is the sum of the discounted flows including the initial investment (negative). NPV > 0 means the project earns more than the required rate and should be accepted.
The internal rate of return (IRR) is the discount rate at which NPV = 0; accept if IRR exceeds the required rate.
Payback period is the time to recover the investment (ignoring the time value of money); discounted payback uses discounted flows. Profitability index (PI) = PV of inflows ÷ investment.
Cost Rs 12,00,000 at year 0; net benefits (savings less running costs) in years 1–5 of Rs 3,50,000, 4,00,000, 4,50,000, 4,00,000 and 3,00,000. Required return 12%.
| Year | Cash flow (Rs) | Discount factor 1/1.12ᵗ | Present value (Rs) | Cumulative (Rs) | Cumulative PV (Rs) |
|---|---|---|---|---|---|
| 0 | -12,00,000 | 1.0000 | -12,00,000 | -12,00,000 | -12,00,000 |
| 1 | 3,50,000 | 0.8929 | 3,12,500 | -8,50,000 | -8,87,500 |
| 2 | 4,00,000 | 0.7972 | 3,18,878 | -4,50,000 | -5,68,622 |
| 3 | 4,50,000 | 0.7118 | 3,20,301 | 0 | -2,48,321 |
| 4 | 4,00,000 | 0.6355 | 2,54,207 | 4,00,000 | 5,886 |
| 5 | 3,00,000 | 0.5674 | 1,70,228 | 7,00,000 | 1,76,114 |
- NPV at 12% = Rs 1,76,114: positive, so accept.
- Payback = 3.00 years (the cumulative cash flow reaches zero exactly at the end of year 3). Discounted payback = 3.98 years.
- IRR = 17.82% (found by bisection; NPV at this rate is 0.0000 within rounding): above 12%, so accept. NPV at 8% is Rs 3,22,421 and at 20% it is Rs -56,674, so the NPV profile crosses zero between 12% and 20%, as the IRR says.
- PI = 1.147: each rupee invested returns Rs 1.147 in present-value terms.
Return on investment (ROI) in its simple accounting form is (average annual net gain) ÷ (initial investment).
Total inflows are Rs 19,00,000, so total net gain = 19,00,000 − 12,00,000 = Rs 7,00,000; average per year = Rs 1,40,000; ROI = 1,40,000 / 12,00,000 = 11.7% per year (or 58.3% over the whole life).
ROI is easy to explain but ignores timing, so use NPV for the decision and ROI for communication. Accounting rate of return on average investment uses half the investment as the base: 23.3%.
Optimistic benefits are the most common error; test the sensitivity of NPV to a 20% lower benefit.
IRR can mislead when comparing mutually exclusive projects of different size, or with alternating signs of cash flow (multiple IRRs); prefer NPV. Always include recurring costs and the cost of change management.
7.4 Total cost of ownership (TCO)
TCO counts every cost over the life of the system, not just the purchase price. The usual surprise is that the initial hardware is a minor share.
A five-year comparison of an on-premise server against a cloud service for the same office (invented figures; year 0 is purchase and set-up):
| Year | On-premise (Rs) | Cloud (Rs) |
|---|---|---|
| 0 | 11,50,000 | 2,00,000 |
| 1 | 6,90,000 | 8,90,000 |
| 2 | 6,90,000 | 8,80,000 |
| 3 | 6,90,000 | 9,20,000 |
| 4 | 6,90,000 | 9,60,000 |
| 5 | 6,90,000 | 10,00,000 |
| 5-year TCO | 46,00,000 | 48,50,000 |
On-premise costs Rs 46,00,000 over five years (Rs 9,20,000 a year); cloud costs Rs 48,50,000, so on-premise minus cloud = Rs -2,50,000 undiscounted.
But on-premise spends heavily at year 0, and discounting at 12% gives a present cost of Rs 36,37,296 for on-premise against Rs 35,28,536 for cloud: cloud is cheaper in present-value terms.
The comparison flips when the discount rate or the subscription growth changes, so state the assumptions. Non-financial factors (data residency, connectivity in the region, control, compliance, skills) decide close cases.
7.5 Break-even analysis
Break-even is the volume at which revenue equals cost. With fixed cost F per year, price p and variable cost v per unit, break-even quantity = F / (p − v), where p − v is the contribution margin.
An online service has Rs 1,80,000 fixed annual cost, earns Rs 30 per transaction and spends Rs 12 per transaction on variable costs.
Contribution = Rs 18 per transaction (60% of price), so break-even = 1,80,000 / 18 = 10,000 transactions a year, which is revenue of Rs 3,00,000. At 20,000 transactions the annual profit would be 20,000 × 18 − 1,80,000 = Rs 1,80,000.
A system that cannot realistically exceed its break-even volume should not be built.
7.6 Managing change and ethics
Systems change jobs; plan the human side. Typical stages: engage users early, communicate benefits and what changes, train before go-live, support staff during the first weeks, and measure adoption.
Ethical issues: privacy of customers and employees, accuracy of information, intellectual property, access (who is excluded?), and accountability for automated decisions.
A code of ethics (ACM, IEEE, a national IT body) offers a reference. Keep the post-implementation review: compare actual benefits and costs with the business case and record lessons.
7.7 Seeing investment decisions: cash flows, NPV, TCO and break-even
Appraisal numbers are easier to trust when you can see them.
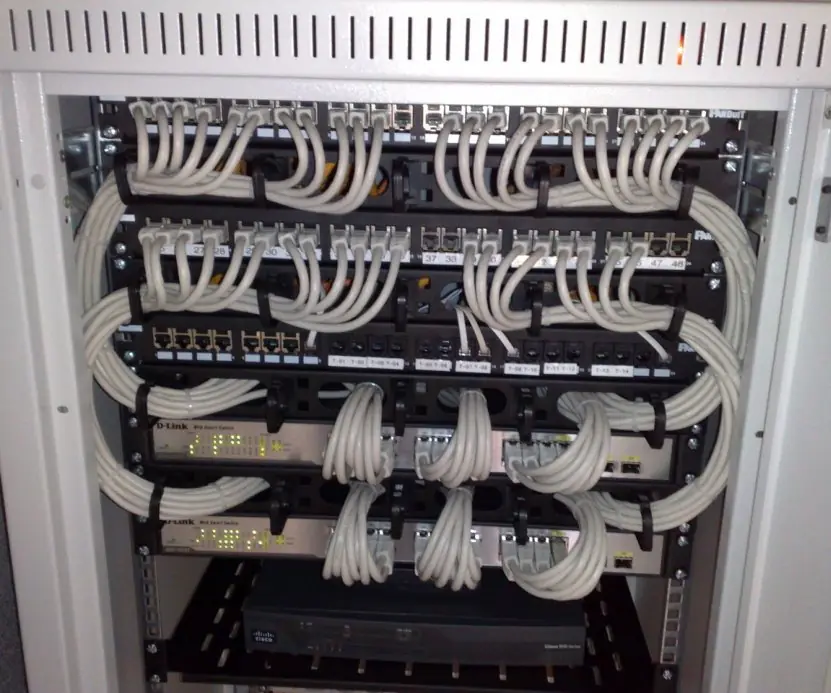
The plate shows two things that belong to every public or private information-system project, a government office that procures it and the network equipment that must be paid for every year.
The figures draw the cumulative cash flow and payback, the NPV profile and IRR, the five-year cost comparison and the break-even line.



7.7.1 Eight reasons information-system projects fail, and how to avoid them
- Unclear goals. A project that starts with "we need a system" and not "we need to cut admission time by half" cannot be judged. People then argue about success after the money is spent. Write the goal and the measure of success before the first contract.
- Optimistic benefits and costs. Planners often overstate savings and understate cost. Test the NPV with benefits 20 percent lower and costs 20 percent higher. If the project still passes, it is a safe bet.
- Ignoring total cost of ownership. The purchase price of hardware is a small part of five years of cost. Licences, staff, power, training and replacement recur every year. Comparing only the first-year price makes the cheaper-looking option the more costly one.
- Weak management support. Without a sponsor who can settle disputes and release people, departments protect their old ways. A hospital system without the director's backing is used by half the wards. Visible leadership is the best predictor of success.
- Poor requirements. Users' real work is not understood, so the system does not fit. Interview users, watch the process and build prototypes. A bank teller can spot a missing field in a minute that an analyst may miss in a month.
- Resistance to change. People fear loss of skill, status or job. Involve them early, train them well and explain what they gain. Resistance that is ignored becomes quiet non-use.
- Bad data and migration. Old records are incomplete and duplicated, and moving them is harder than expected. Clean and check the data before and after loading it. A system that shows wrong balances on day one never recovers trust.
- No plan for support and ethics. After go-live the system needs support, updates and security, and it must treat users' data fairly and lawfully. Budget for these from the start and set rules on privacy and access. Projects that stop at go-live decay quickly.
Chapter summary
- Choose build, buy, customise or outsource on fit, cost, skills and risk; failures are usually organisational.
- Discount cash flows; accept projects with NPV > 0 or IRR above the required rate; payback and ROI are simple supplements.
- TCO includes all lifetime costs; compare options at present value.
- Break-even volume = fixed cost ÷ contribution margin.
- Change management and post-implementation review complete the investment cycle.
Practice
- List the stages of the SDLC and three reasons projects fail.
- When would you build rather than buy?
- A project costs Rs 5,00,000 and returns Rs 2,00,000 for each of 3 years. Compute payback and simple ROI.
- For the same project at 10%, compute the NPV and say whether to accept.
- Define IRR and state the acceptance rule.
- Why can IRR mislead when comparing projects?
- Why might cloud TCO be lower in present value even if the nominal total is higher?
- Fixed cost Rs 2,40,000, price Rs 50, variable cost Rs 20. Compute the break-even volume.
- How much profit at 10,000 units in question 8?
- Name three actions for managing user adoption.
Answers and worked solutions
1. Investigation/feasibility, analysis, design, construction, testing, implementation, maintenance. Failures: unclear requirements, weak user involvement, scope creep.
2. When the process is unique and a source of advantage, no package fits, and the skills exist.
3. Payback = 5,00,000 / 2,00,000 = 2.5 years. Total gain = 6,00,000 − 5,00,000 = 1,00,000; per year 33,333; ROI = 33,333 / 5,00,000 = 6.7% per year.
4. Annuity factor at 10% for 3 years = 2.4869; PV = 2,00,000 × 2.4869 = 4,97,370; NPV = 4,97,370 − 5,00,000 = −2,630: marginally negative, so reject (or negotiate).
5. The discount rate at which NPV is zero; accept when IRR is above the required rate.
6. It ignores project scale, can give multiple values when cash-flow signs alternate, and may rank mutually exclusive projects differently from NPV.
7. Cloud defers costs (low year-0 spending) and discounting makes later costs smaller.
8. 2,40,000 / (50 − 20) = 8,000 units.
9. 10,000 × 30 − 2,40,000 = Rs 60,000.
10. Early involvement, training before go-live, visible management support and post-go-live help.
Model answers: medium (5 marks) and long (10 marks) questions
Q1 (5 marks). A hospital record system costs Rs 12,00,000 and gives net benefits of Rs 3,50,000, 4,00,000, 4,50,000, 4,00,000 and 3,00,000 in years 1 to 5. Required return is 12 percent. Find the payback period, NPV and IRR, and decide.
Introduction. Appraisal compares the cost of a project with the discounted value of its benefits (section 7.3, Figures 7.1 and 7.2).
- Payback. Cumulative cash flow: -12,00,000; -8,50,000; -4,50,000; 0 at the end of year 3. Payback = 3.00 years.
- Present values at 12 percent. Year 1: 3,50,000 / 1.12 = 3,12,500; year 2: 3,18,878; year 3: 3,20,301; year 4: 2,54,207; year 5: 1,70,228.
- NPV. Sum of present values = 13,76,114, less 12,00,000 = Rs 1,76,114, which is positive.
- Discounted payback. Cumulative PV is -2,48,321 at year 3 and +5,886 at year 4, so it is recovered in about 3.98 years.
- IRR. The rate at which NPV = 0 is found by trial or bisection: 17.82 percent; NPV is +3,22,421 at 8 percent and -56,674 at 20 percent.
- Decision. NPV > 0 and IRR (17.82 percent) is greater than 12 percent, so accept the project.
| Year | Cash flow (Rs) | PV at 12% (Rs) |
|---|---|---|
| 0 | -12,00,000 | -12,00,000 |
| 1 | 3,50,000 | 3,12,500 |
| 2 | 4,00,000 | 3,18,878 |
| 3 | 4,50,000 | 3,20,301 |
| 4 | 4,00,000 | 2,54,207 |
| 5 | 3,00,000 | 1,70,228 |
Conclusion. The project returns its cost in three years, beats the required 12 percent and has a positive NPV of Rs 1,76,114, so it should be accepted.
Q2 (5 marks). An online service has fixed costs of Rs 1,80,000 a year, earns Rs 30 per transaction and spends Rs 12 per transaction on variable cost. Find the break-even volume and the profit at 20,000 transactions.
Introduction. Break-even analysis finds the volume at which total revenue equals total cost (section 7.5, Figure 7.4).
- Contribution margin. Price - variable cost = 30 - 12 = Rs 18 per transaction, which is 60 percent of the price.
- Break-even quantity. Fixed cost / contribution = 1,80,000 / 18 = 10,000 transactions a year.
- Break-even revenue. 10,000 x 30 = Rs 3,00,000.
- At 20,000 transactions. Revenue = 20,000 x 30 = Rs 6,00,000; total cost = 1,80,000 + 20,000 x 12 = Rs 4,20,000.
- Profit. 6,00,000 - 4,20,000 = Rs 1,80,000; equal to (20,000 - 10,000) x 18.
- Meaning. Below 10,000 transactions the service loses money; each transaction above adds Rs 18. Lowering fixed cost or raising the contribution brings break-even down.
Conclusion. The service must handle 10,000 transactions a year to cover its costs, and doubling that volume gives a profit of Rs 1,80,000.
Q3 (10 marks). Explain how an organisation develops or acquires an information system and evaluates it financially. Discuss cost-benefit analysis, NPV, payback, TCO, and the management of change and ethical issues.
Introduction. A new information system is an investment that changes how people work. The organisation must choose how to obtain it (build, buy or rent), decide whether it is worth the money, and make sure people accept and use it.
Good decisions need both financial analysis and attention to people and ethics (sections 7.1 to 7.6, Figures 7.1 to 7.4).
- Acquisition options. Build in-house (full fit, high cost and risk), buy a packaged product (fast, may need adaptation), rent software as a service (low start-up cost, ongoing fee), or outsource development.
- Development approaches. SDLC (waterfall), prototyping, agile iterations and end-user development, chosen by how well the requirements are known.
- Cost-benefit analysis. List tangible costs (hardware, software, training) and benefits (savings, extra revenue) and intangible ones (satisfaction, image).
- NPV and IRR. Discount future flows at the required rate; accept if NPV > 0 and IRR is above the required rate (the hospital example: NPV Rs 1,76,114 and IRR 17.82 percent).
- Payback. The time to recover the investment (3.00 years; discounted 3.98 years); simple but ignores flows after payback.
- TCO. Count all costs over the life: the five-year costs were Rs 46,00,000 on-premise and Rs 48,50,000 in the cloud, but in present value cloud was cheaper (Rs 35,28,536 against Rs 36,37,296).
- Break-even. Fixed cost / contribution, as in Rs 1,80,000 / 18 = 10,000 transactions.
- Change management and ethics. Sponsor, training, communication, data migration and support; ethical duties of privacy, fairness, accessibility and honesty about what the system does.
| Method | Question answered | Strength | Weakness |
|---|---|---|---|
| Payback | How fast? | Simple | Ignores timing and later flows |
| NPV | How much value? | Best decision rule | Needs a discount rate |
| IRR | What return? | Easy to compare with a hurdle rate | Can mislead for different sizes |
| TCO | Real cost? | Includes recurring cost | Needs careful estimates |
Conclusion. The right choice combines method of acquisition, a sound financial test (NPV first, with payback, IRR and TCO as support) and a plan to manage the people side. Many failures come from skipping the last step and not from wrong arithmetic.