Unit 1 · 6 teaching hours · 21 min read
Information Systems in the Enterprise
What the syllabus asks for 7
- Data, information and knowledge
- Systems thinking
- The organisation pyramid and decision levels
- Types of information systems
- How the systems fit together
- Information systems in Nepali organisations
- Seeing information systems: machines, pyramids and flows
A Kathmandu bank teller types an account number and the balance appears in a second; at the same moment the branch manager's dashboard shows today's deposits, the credit committee reads a report on loan defaults, and the board looks at a one-page view of profit against the plan.
Four people, four screens, one organisation: each gets different information, built from the same underlying records, for a different kind of decision. That layering is the subject of this unit.
A management information system (MIS) is not one program; it is the whole arrangement of people, data, technology and procedures that turns an organisation's raw events into the information its managers need.
- The difference between data, information and knowledge, and the attributes of good information.
- The system view of an organisation and the components of an information system.
- The five classic system types (TPS, MIS, DSS, ESS, KMS) and how they map to organisational levels.
- Nepali examples at every level, and how the pieces connect.
1.1 Data, information and knowledge
Data are raw, unprocessed facts: the number 4500, the string "Sita Sharma", a timestamp.
Information is data that has been processed and put in context so that it is meaningful to a decision-maker: "Sita Sharma's average daily balance this month was Rs 4,500, which is below the Rs 5,000 minimum".
Knowledge is information combined with experience, rules and judgement that lets people act: "customers who fall below the minimum for three months usually close the account, so call her before month-end".
| Level | Example (a bank) | Who creates it |
|---|---|---|
| Data | 4500; 2082-01-15 10:32; "Sita Sharma" | Sensors, forms, transactions |
| Information | Average balance of Rs 4,500 is below the minimum | Processing, summarising, comparing |
| Knowledge | Customers below minimum for 3 months tend to leave; call early | Analysis plus experience |
Information is useful only if it has the right attributes. A report can be accurate and still useless if it arrives late.
| Attribute | Question to ask | Failure example |
|---|---|---|
| Accuracy | Is it free from errors? | Interest computed on the wrong balance |
| Timeliness | Is it available when the decision is made? | A stock report that arrives after the order deadline |
| Relevance | Does it matter to this decision? | Pages of branch-level detail for the CEO |
| Completeness | Is anything essential missing? | Sales report without returns |
| Consistency | Do different reports agree? | Two departments with two customer counts |
| Accessibility and security | Can the right people (and only they) get it? | Salary data visible to all staff |
| Cost-effectiveness | Is the value above the cost of producing it? | A daily report nobody reads |
1.2 Systems thinking
A system is a set of interrelated components working together towards a goal. It has inputs, processes, outputs, and usually feedback (output compared with a goal to adjust the input) and control.
It lies inside a boundary; whatever is outside but interacts with it is the environment.
An organisation is an open system: it takes people, money and materials from its environment (customers, suppliers, regulators such as Nepal Rastra Bank) and returns goods, services and information.
A savings cooperative takes inputs (member deposits, staff time, rules from the Department of Cooperatives), runs processes (loan appraisal, interest calculation, audit) and gives outputs (loans, dividends, statements).
Feedback arrives as the loan-default rate; if it exceeds the target, control tightens the appraisal rules. Members, regulators and competing banks are the environment.
An information system (IS) is a system whose purpose is to collect, store, process and distribute information to support operations, management and decision-making. It has five components:
- Hardware: computers, servers, phones, POS terminals, network devices.
- Software: system software, application software, and the databases' management software.
- Data: the stored facts and the database structure.
- Procedures: the documented steps for using and controlling the system (backups, approvals, month-end closing).
- People: users, analysts, developers, operators, and the managers who decide. People are the component most often under-budgeted and the one whose failure sinks most projects.
A computer-based information system (CBIS) is the version with a computer at its centre, while a management information system is the CBIS (together with its manual procedures) that serves managerial needs.
Information technology (IT) is the technology; information systems include the people and organisation that use it. Buying servers is an IT purchase; changing how a department works with them is an IS project.
1.3 The organisation pyramid and decision levels
Organisations have three management levels, and each makes different decisions that need different information.
| Level | Typical people | Decisions | Time horizon | Nature of problem | Information needed |
|---|---|---|---|---|---|
| Operational | Tellers, supervisors, store keepers | Approve this withdrawal, reorder this item | Minutes to days | Structured | Detailed, current, internal |
| Tactical (middle) | Branch managers, department heads | Staffing next month, budget variances | Weeks to a year | Semi-structured | Summaries, comparisons, exceptions |
| Strategic (top) | CEO, board | Open a new province, enter e-commerce | Years | Unstructured | Aggregated, external, forecasts |
Herbert Simon described decisions along a spectrum.
A structured decision has a known procedure (compute overtime pay), an unstructured one has none (should we acquire a competitor?), and a semi-structured one has a procedure for part of it (set next quarter's stock levels using a forecast and a manager's judgement).
Computers excel at the first, assist in the second and third. The information systems of an enterprise are therefore arranged to match.
1.4 Types of information systems
Transaction processing systems (TPS)
A TPS records the routine, repetitive events of the business: a sale, a deposit, a payroll run, a stock issue. It sits at the operational level and is the source of nearly all the data the other systems use.
Its requirements are speed, reliability, accuracy and a full audit trail.
A TPS runs in batch mode (transactions are collected and processed together, such as overnight payroll or cheque clearing) or online (real-time) mode (each transaction is processed immediately, such as an ATM withdrawal or a Nepal Stock Exchange order).
A reliable TPS obeys the ACID properties of a database transaction: atomic (all or nothing), consistent (rules always satisfied), isolated (concurrent transactions do not interfere), durable (committed work survives a crash).
An ATM withdrawal of Rs 5,000 must (1) check the PIN and the available balance, (2) debit the account, (3) instruct the dispenser, and (4) write the log.
If the machine jams after step 2 the debit must be rolled back; otherwise the customer loses money. This is atomicity in practice, and the reconciliation reports that find such cases next morning are TPS outputs.
Management information systems (MIS) in the narrow sense
An MIS takes the TPS data and produces summary reports for middle management.
Reports are scheduled (a daily sales summary), exception (only branches whose cash shortage exceeds a threshold) or on-demand (a manager asks for stock by warehouse).
They are mostly predefined, answer known questions ("how did we do against plan?") and are based on internal data. Their value lies in comparison: actual against budget, this month against last month, branch against branch.
Decision support systems (DSS)
A DSS supports semi-structured decisions through interactive models and what-if analysis.
Its three parts are a database (internal and external data), a model base (forecasting, optimisation, simulation, spreadsheets) and a user interface (dialogue).
A manager at a hydropower company varies the rainfall forecast and tariff and watches profit change. The emphasis is on flexibility and the manager remaining in control.
Unit 4 develops decision tables and expected-value analysis, the simplest DSS models.
Executive support systems (ESS)
An ESS (or executive information system) gives senior managers a quick, graphical, drill-down view of key performance indicators (KPIs), combining internal summaries with external news, market and competitor data.
It is a dashboard: green/amber/red indicators, trends, and the ability to click on a figure and see the branch and the transactions behind it.
Its data come from the MIS, DSS and external feeds; its users have little time and need exceptions highlighted.
Knowledge management systems (KMS) and office automation
A KMS captures, stores and shares what an organisation knows: lessons learned, expert directories, policy documents, wikis, case libraries.
Explicit knowledge can be written down (a manual); tacit knowledge lives in people's heads (how an experienced loan officer smells trouble). Unit 4 covers the SECI cycle that converts one into the other.
Office automation systems (email, word processing, scheduling, video meetings) support everyday work and communication across all levels.
| System | Level | Main inputs | Main outputs | Typical users | Nepali example |
|---|---|---|---|---|---|
| TPS | Operational | Transactions | Updated records, receipts | Clerks, tellers | Core banking posting; NEA bill collection |
| MIS | Tactical | TPS data | Summary and exception reports | Department managers | Branch performance report |
| DSS | Tactical/Strategic | Data plus models | Analyses, forecasts | Analysts, managers | Loan portfolio risk what-if |
| ESS | Strategic | Aggregated internal, external | Dashboards, KPIs | Executives | CEO scorecard of profit, NPL ratio |
| KMS | All | Documents, expertise | Searchable knowledge | Knowledge workers | Internal wiki of audit findings |
1.5 How the systems fit together
The systems share a database and feed upward: TPS data are summarised by the MIS, analysed by the DSS and displayed on the ESS.
Information also flows horizontally between functions (sales, production, finance, HR) and outward to customers, suppliers and regulators.
When each department builds its own system the result is islands of information with duplicated and conflicting data (two customer lists, two product codes).
Enterprise systems (ERP, Unit 3) and integration through shared databases and APIs are the remedy.
Functional information systems are the other way to slice the organisation: accounting and finance (ledgers, budgeting, tax), sales and marketing (orders, CRM, campaigns), manufacturing and operations (inventory, scheduling, quality), human resources (payroll, attendance, recruitment).
Each contains TPS, MIS and DSS elements.
1.6 Information systems in Nepali organisations
Nepal's public and private sectors already show the whole pyramid. Core banking systems in the commercial banks are TPS at their centre, with branch MIS reporting to Nepal Rastra Bank.
The Nepal Stock Exchange's Trade Management System is an online TPS. The Inland Revenue Department's taxpayer portal and the customs ASYCUDA World system are TPS with MIS reporting.
The Nagarik App and the National ID programme (see Society and Technology) show e-government systems. At small scale, a Palika's (municipality's) ward-registration software is a TPS whose summaries feed the mayor's decisions.
The recurring challenges are the same everywhere: poor data quality at entry, unreliable connectivity outside cities, scarce trained staff, and systems bought without redesigning the procedures around them.
1.7 Seeing information systems: machines, pyramids and flows
Information systems are easier to grasp when the machines and the levels of an organisation are drawn out.
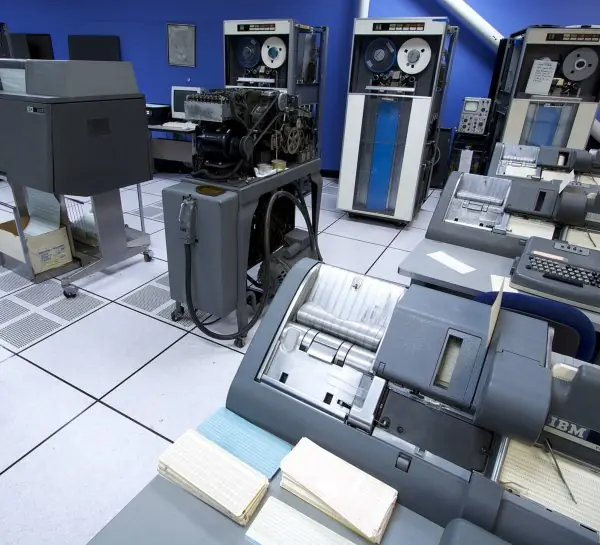
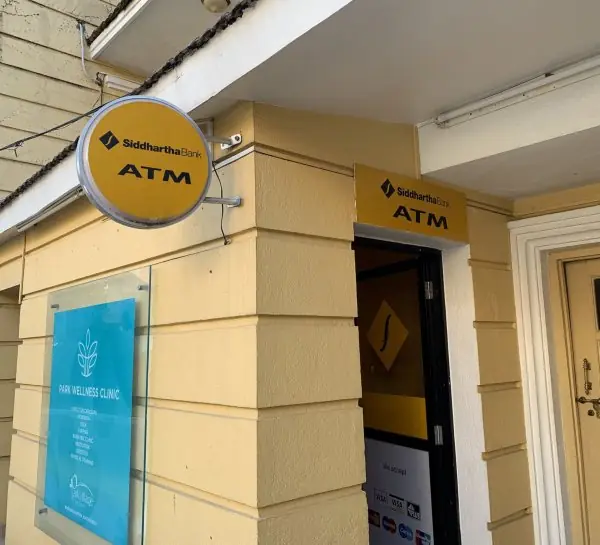
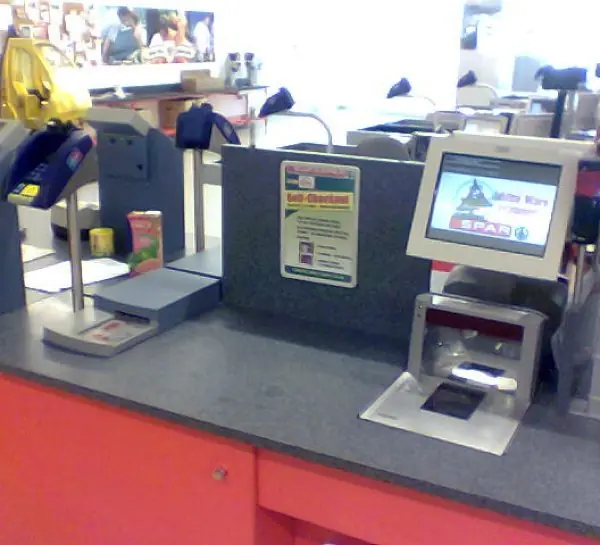
The plate shows three transaction-processing machines from three eras, and the figures show how data becomes knowledge, which system serves which level of management, and how the systems feed one another.


1.7.1 Eight benefits of information systems for an organisation
- Faster and more accurate records. A transaction system captures each event once and stores it in a database, so there is no copying from paper to paper. A college fee counter that records a payment on the screen gives the receipt in seconds. Totals at the end of the day then match without a long search for errors.
- Better decisions. Managers see current numbers instead of guesses. A department head who reads the pass percentage of each subject can find the weak subject before the next exam. Good decisions need good information, and systems deliver it on time.
- Lower costs. Automation reduces repeated manual work such as typing the same marks in three registers. A bank that moved statements to an app saves printing and posting. The saving is real, but the system itself has a cost (Unit 7).
- Improved customer service. Customers get answers and services at any hour. The Nagarik App and mobile banking let citizens and clients act without queues. A faster service builds trust and brings repeat business.
- Competitive advantage. Systems can create a lead that rivals find hard to copy, such as a delivery tracking system or a wide wallet network. A company known for reliable online ordering wins customers from slower rivals. The advantage lasts only while the system keeps improving.
- Better control and security. Access rights, logs and audit trails show who did what and when. A marks-entry system that records every change prevents quiet alteration of results. Control also protects the organisation from fraud.
- Better communication and coordination. Email, shared databases and messaging connect departments and branches. A bank with branches in Biratnagar and Nepalgunj sees the same customer record in both. Coordination improves because everyone works from the same facts.
- Support for growth and new business. A system built for 500 customers can often serve 50,000 with more servers. An online shop can open a new city without opening a new building. This lets small Nepali firms reach customers abroad as well.
Chapter summary
- Data become information when processed in context, and knowledge when combined with experience; good information is accurate, timely, relevant, complete, consistent, secure and worth its cost.
- A system has inputs, processes, outputs, feedback and control inside a boundary; an IS has hardware, software, data, procedures and people.
- Decisions are structured, semi-structured or unstructured and are made at operational, tactical and strategic levels.
- TPS record events (batch or online, ACID); MIS summarise them; DSS model what-ifs; ESS display KPIs; KMS share knowledge.
- Islands of information are fixed by integration and enterprise systems.
Practice
- Distinguish data, information and knowledge with an example from a school.
- List the seven attributes of good information and give a failure of timeliness.
- Name the five components of an information system and explain why "people" matters most.
- Match:aapprove a cash withdrawal,bnext month's staffing,center a new market, to a management level and a problem type.
- What are the ACID properties? Which one is violated if an ATM debits the account but never dispenses cash and the debit is not undone?
- Compare batch and online processing with one example each.
- Describe the three parts of a DSS.
- Why does an ESS emphasise exceptions and drill-down?
- What are "islands of information" and how are they removed?
- Give one Nepali example for each of TPS, MIS, DSS, ESS and KMS.
Answers and worked solutions
1. Data: the marks 62, 75, 48. Information: Rita's average is 61.7, the class average is 58 so she is above it. Knowledge: students who score below 50 in the first test usually fail unless given remedial classes, so enrol them early.
2. Accuracy, timeliness, relevance, completeness, consistency, accessibility/security, cost-effectiveness. Timeliness failure: a stock-out report that reaches the buyer after the supplier's order deadline.
3. Hardware, software, data, procedures, people. People operate the system, enter its data and act on its output; poor training or resistance defeats an otherwise sound system.
4.(a) Operational, structured.(b) Tactical, semi-structured.(c) Strategic, unstructured.
5. Atomicity, consistency, isolation, durability. Atomicity (all-or-nothing) is violated; consistency of the books is also broken until the debit is reversed.
6. Batch: payroll or cheque clearing run at night. Online: an ATM withdrawal or an NEPSE order processed immediately.
7. A database, a model base and a user interface (dialogue system).
8. Executives lack time and need to see only what deviates from plan, then click through (drill down) to the branch or transaction responsible.
9. Separate departmental systems with duplicate, conflicting data; removed by a shared database, master data management, integration/API layers or an ERP.
10. TPS: core-banking posting. MIS: branch performance report. DSS: loan-portfolio what-if model. ESS: CEO dashboard of profit and NPL ratio. KMS: an intranet wiki of audit findings.
Model answers: medium (5 marks) and long (10 marks) questions
Q1 (5 marks). Distinguish between data, information and knowledge with examples from a college.
Introduction. The three words describe three stages of value in the same material, from raw facts to something that supports an action (section 1.1, Figure 1.1).
- Data are raw, unprocessed facts without context, for example the number 78 or the word Sharma. Data on their own cannot support a decision.
- Information is data that has been processed and given context so that it has meaning: Sita Sharma scored 78 in DBMS in 2081. A report of the average marks per subject is also information.
- Knowledge is information combined with experience, patterns and rules that tell us what to do. For example, students who attend 80 percent or more of lab classes average 15 marks more, so low attendance should trigger counselling.
- Relationship. Data are processed into information, information is analysed into knowledge and knowledge is used to take actions that create new data.
- Value. Each step adds context and use, and each needs both software and people.
| Point | Data | Information | Knowledge |
|---|---|---|---|
| Meaning | None alone | Has context | Has pattern and use |
| Example | 78 | Sita scored 78 in DBMS | Lab attendance raises marks |
| Supports | Nothing | Reports | Decisions |
Conclusion. A system turns data into information, and people turn information into knowledge; the value of an information system lies in this chain.
Q2 (5 marks). Compare transaction processing systems, management information systems and decision support systems.
Introduction. Each type of system serves a different level and kind of decision in the organisation (section 1.4, Figures 1.2 and 1.3).
- TPS. It records the daily events of the business, such as fee payments, ATM withdrawals and orders. Its users are operational staff, the decisions are structured, and its main needs are speed, accuracy and reliability.
- MIS. It summarises TPS data into routine reports, such as monthly fees collected or subject-wise pass percentage. Users are middle managers and the reports are periodic, fixed in format.
- DSS. It combines data with models and lets the manager ask what-if questions, for instance the effect of a 5 percent fee rise on income. It is interactive and used for semi-structured decisions.
- Data flow. TPS feed the database; MIS and DSS read from it.
- Output and flexibility. TPS give detailed records, MIS give summaries, DSS give analyses and answers to special questions.
| Point | TPS | MIS | DSS |
|---|---|---|---|
| Users | Clerks | Middle managers | Managers and analysts |
| Decision type | Structured | Mostly structured | Semi-structured |
| Output | Records, receipts | Routine reports | What-if analysis |
| Example | ATM withdrawal | Monthly fee report | Fee-increase model |
Conclusion. TPS collect, MIS report and DSS analyse; together they give a complete flow from the counter to the manager's desk.
Q3 (10 marks). Explain the types of information systems at the different levels of an organisation. Describe how they are related, with a diagram and an example of a college or bank.
Introduction. An organisation is commonly drawn as a pyramid of operational, management and strategic levels.
Each level has different decisions, a different time horizon and a different need for information, so no single system can serve all of them.
Information systems are therefore grouped into types that match the levels (sections 1.3 to 1.5, Figures 1.2 and 1.3).
- Operational level, TPS. Transaction processing systems record daily events such as deposits, withdrawals, admissions and fee receipts. Decisions here are structured and follow rules.
- Office automation and KMS. Word processing, email and document systems help all levels, and knowledge-management systems store lessons and expertise so that they can be reused.
- Management level, MIS. MIS produce summary reports from TPS data: branch-wise deposits per month, subject-wise results. They support control and planning for the next weeks or months.
- Management level, DSS. DSS add models and what-if tools for semi-structured decisions, for example how many loan officers a bank needs if loan applications grow 20 percent.
- Strategic level, ESS. Executive support systems show a few key indicators and trends on a dashboard, drawing on internal and external data (market share, interest rates). They support unstructured, long-term decisions.
- Relationships. TPS are the base and supply the data. MIS, DSS and ESS draw on the same database, and decisions made at the higher levels produce new transactions below.
- Characteristics by level. Moving up the pyramid, detail decreases, time horizon grows and the share of unstructured decisions grows.
- Nepali example. A bank branch records deposits in the core banking system (TPS), the head office prints monthly branch reports (MIS), the credit department models loan growth (DSS) and the board watches a dashboard of profit, non-performing loans and deposits (ESS).
| Level | Typical user | System | Decision type |
|---|---|---|---|
| Operational | Clerk, teller | TPS | Structured |
| Management | Department head, branch manager | MIS, DSS | Semi-structured |
| Strategic | Chief executive, board | ESS | Unstructured |
Conclusion. The systems form a hierarchy that mirrors the organisation: TPS capture the facts, MIS and DSS turn them into reports and analyses, and ESS give the top managers a clear view of the whole organisation.