Unit 1 · 4 teaching hours · 33 min read
Introduction to Computer Networks
What the syllabus asks for 10
- What a network is
- Types of networks
- Topologies
- Network devices
- Layered architecture and protocol stacks
- The OSI reference model
- The TCP/IP model
- Performance: bandwidth, delay and throughput
- Standards and organisations
- Seeing the ideas: networks, topologies, layers and delay
When you open a page in your browser, a few hundred bytes leave your laptop, cross a Wi-Fi link, an Ethernet cable, a fibre to your ISP, perhaps an undersea cable, and arrive at a server that answers in less than a tenth of a second.
Nobody designed that path for you in particular. It works because every device agrees on layers: small, replaceable pieces that each do one job and talk to the same piece on the other side.
This unit gives you the vocabulary, the two layered models you will be examined on, and the first calculations (delay and throughput) that run through the whole book.
- What a network is, the main network types and topologies, and the devices that build them.
- The OSI reference model and the TCP/IP model, layer by layer, and how data is encapsulated.
- Delay, throughput, bandwidth–delay product and why they decide how fast a network feels.
- Standards bodies and the vocabulary used for the rest of the book.
1.1 What a network is
A computer network is a set of autonomous devices (hosts) connected by links so that they can exchange data. The devices at the edge are end systems or hosts: PCs, phones, servers, sensors.
The devices in the middle that move data from link to link are intermediate systems: switches and routers.
Every network has four ingredients: senders and receivers, a medium (copper, fibre, radio), protocols (the agreed rules) and addressing (so data can find its destination).
A protocol defines three things: the syntax (format of messages, field sizes), the semantics (what each field means and what action to take) and the timing (when to send, how fast, what to do on silence).
HTTP, TCP, IP and Ethernet are protocols; so are the rules for how a teacher chooses who may speak in a class.
Why we network
- Resource sharing: one printer, one database server, one Internet connection for many users.
- Communication: e-mail, voice and video calls, messaging.
- Reliability: data replicated over several machines; a failed machine does not stop the service.
- Cost saving: many cheap clients and a few strong servers instead of many strong machines.
- Scalability: add a server or a link when load grows.
1.2 Types of networks
| Type | Typical span | Typical technology | Example |
|---|---|---|---|
| PAN | a few metres | Bluetooth, USB | phone ↔ earbuds |
| LAN | a room to a campus | Ethernet, Wi-Fi | college computer lab |
| MAN | a city | fibre rings, metro Ethernet | cable-TV or ISP network in Kathmandu valley |
| WAN | country to world | leased lines, MPLS, submarine cable | an ISP backbone; the Internet |
A LAN is usually owned by one organisation, runs at high speed (100 Mbps to 10 Gbps) and has low error rates. A WAN crosses public property, so it usually rents capacity from carriers, is slower per rupee spent and has longer delays.
The Internet is a network of networks: thousands of independently owned networks (autonomous systems) interconnected using the one protocol, IP.
An intranet is an organisation's private network using Internet technology; an extranet extends it to selected partners. A VPN builds a private network across the public Internet using encryption (Unit 7).
Client–server and peer-to-peer
In the client–server model a server waits for requests and clients start them (web, e-mail). In peer-to-peer every node can be both (BitTorrent, some voice-call systems).
Most real services mix both: your messaging app is a client of a server but may exchange media directly peer to peer.
1.3 Topologies
The topology is the arrangement of links.
| Topology | Description | Links for n nodes | Strength | Weakness |
|---|---|---|---|---|
| Bus | all nodes on one shared cable | 1 cable | cheap, little cable | one break stops everyone; collisions |
| Star | each node to a central hub or switch | n | easy to add or remove, failures isolated | centre is a single point of failure |
| Ring | each node to two neighbours in a loop | n | orderly access (token) | one break stops a single ring |
| Mesh (full) | every node to every other | n(n − 1)/2 | very reliable | cabling grows quickly |
| Tree | stars connected hierarchically | n − 1 | scalable | root dependence |
| Hybrid | mixture | — | fits real buildings | more complex |
For a full mesh of 10 nodes you need 10 × 9 / 2 = 45 links and 9 ports per node; this is why full meshes appear only in small cores. Modern LANs are almost always physical stars (every cable ends at a switch) even if they behave like a logical bus or ring inside.
1.4 Network devices
- Repeater: regenerates a weakened signal (layer 1).
- Hub: a multi-port repeater; whatever arrives on one port goes out on all others, so all ports share one collision domain (layer 1). Obsolete.
- Bridge / switch: learns which MAC address is behind which port and forwards frames only where needed (layer 2). Each port is a separate collision domain.
- Router: forwards packets between networks using IP addresses and a routing table (layer 3). Each interface is a separate broadcast domain.
- Gateway: a general word for a device converting between different protocol stacks, also used for the "default gateway" router.
- Access point: bridges Wi-Fi to wired Ethernet. Modem: converts digital data to a signal suited to a medium (telephone line, coaxial cable, fibre ONT).
- Firewall: filters traffic by rules (Unit 7). Load balancer: spreads requests over several servers.
A collision domain is the set of devices whose simultaneous transmissions interfere; a broadcast domain is the set that receives a broadcast frame. A switch divides collision domains; a router (or VLAN) divides broadcast domains.
1.5 Layered architecture and protocol stacks
Network software is built in layers. Layer n offers a service to layer n + 1 above it and uses the service of layer n − 1 below.
Layer n on one machine talks to layer n on the other using a protocol, but in reality the data goes down the stack, over the medium and up the other stack.
Layering gives modularity (replace Wi-Fi by Ethernet without changing the browser), easier standardisation and easier fault finding. The cost is some overhead and occasional duplication of functions.
Connection-oriented and connectionless service
A connection-oriented service (TCP, telephone call) sets up a connection, uses it, and releases it; data arrives in order and reliably.
A connectionless service (UDP, IP, postal letters) sends each unit independently with no set-up; units may be lost, duplicated or reordered. "Reliable" means the service recovers from loss by retransmission; "unreliable" means best effort, not "bad".
1.6 The OSI reference model
The Open Systems Interconnection model of ISO (1984) has seven layers. It is a reference model: nobody implements it exactly, but its vocabulary is universal.
| No. | Layer | Unit of data | Job | Examples |
|---|---|---|---|---|
| 7 | Application | message | services seen by user programs | HTTP, SMTP, DNS, FTP |
| 6 | Presentation | message | data format, encryption, compression | TLS record encoding, JPEG, UTF-8 |
| 5 | Session | message | dialogue control, checkpoints, synchronisation | RPC sessions, NetBIOS |
| 4 | Transport | segment / datagram | process-to-process delivery, reliability, flow and congestion control | TCP, UDP |
| 3 | Network | packet | host-to-host delivery across networks, routing, logical addressing | IP, ICMP, OSPF |
| 2 | Data link | frame | node-to-node delivery on one link, framing, MAC addressing, error detection | Ethernet, Wi-Fi, PPP |
| 1 | Physical | bit | transmission of raw bits as signals | cables, connectors, radio, line coding |
Please Do Not Throw Sausage Pizza Away — Physical, Data link, Network, Transport, Session, Presentation, Application (bottom to top).
The lower three layers are the network-support layers; the upper three are user-support layers; the transport layer links the two groups.
Physical address, logical address, port. A frame carries a MAC address (layer 2, local), a packet carries an IP address (layer 3, end to end), a segment carries port numbers (layer 4, identifies the process, for example 80 for HTTP).
On the way, the MAC addresses are rewritten at every router, the IP addresses are not (unless NAT is used), the ports are not.
1.7 The TCP/IP model
The model of the Internet has four (sometimes drawn as five) layers and grew from working protocols rather than from a committee.
| TCP/IP layer | Corresponds to OSI | Main protocols |
|---|---|---|
| Application | 5, 6, 7 | HTTP, HTTPS, SMTP, IMAP, DNS, DHCP, SSH |
| Transport | 4 | TCP, UDP |
| Internet | 3 | IPv4, IPv6, ICMP, ARP (often placed between 2 and 3) |
| Link (network access) | 1, 2 | Ethernet, Wi-Fi, PPP |
The TCP/IP stack is the standard in practice because it was already deployed, free, and simple. Compare: OSI had a clean theory but its protocols arrived late; TCP/IP had protocols first and a model written afterwards.
Both models treat the network layer service differently: OSI supported both connection-oriented and connectionless service at layer 3 but only connection-oriented at layer 4 in its original form, whereas TCP/IP supports only connectionless at the Internet layer but both at the transport layer.
Encapsulation
When the application hands a message to TCP, TCP adds a header to form a segment; IP adds its header to form a packet; the link layer adds a header and (usually) a trailer to form a frame; the physical layer turns it into signals.
The receiver reverses the process (decapsulation). With a 20-byte TCP header, a 20-byte IPv4 header and an 18-byte Ethernet header and trailer, an application payload of 1460 bytes becomes a frame of 1460 + 20 + 20 + 18 = 1518 bytes.
The headers are overhead: a 1-byte message in the same frame needs 58 bytes of headers.
1.8 Performance: bandwidth, delay and throughput
Bandwidth (here: link rate) is the number of bits per second the link can transmit, for example 100 Mbps. Throughput is the rate actually achieved end to end; it is limited by the slowest link (the bottleneck) and by protocols.
Latency is the time from the start of sending to the start of receiving. It has four parts.
| Component | Formula | Depends on |
|---|---|---|
| Transmission delay | L / R (bits ÷ bits per second) | packet length, link rate |
| Propagation delay | d / s (metres ÷ speed of signal) | distance, medium (≈ 2 × 10⁸ m/s in fibre or copper) |
| Queuing delay | varies | traffic load |
| Processing delay | small | router speed |
A 1500-byte packet on a 100 Mbps link: L / R = 12,000 bits / 10⁸ bps = 0.12 ms. If the link is 2000 km long, the propagation delay is 2 × 10⁶ m / (2 × 10⁸ m/s) = 10 ms.
So on this long link the propagation delay is about 83 times larger than the transmission delay; making the link faster to 1 Gbps would reduce the 0.12 ms by a factor of 10 but would barely change the 10 ms.
Store-and-forward and pipelining
A router receives a whole packet before it forwards it (store and forward).
For a packet of L bits crossing N links of rate R, the total transmission time is N × L / R. For an 8000-byte packet on 3 links of 1 Mbps: 3 × 64,000 / 10⁶ = 0.192 s. If instead a message of 10⁶ bits is cut into 1000 packets of 1000 bits, the first packet needs 3 ms to arrive and each following packet arrives 1 ms later, so the whole message needs 3 ms + 999 ms = 1.002 s. Without packetising, the whole message would take 3 × 1 s = 3 s. Pipelining is why packet switching wins for bulk data.
Bandwidth–delay product
The bandwidth–delay product (BDP) = rate × round-trip (or one-way) delay is the number of bits "in flight" on a full pipe. A 1 Gbps path with a 50 ms delay holds 10⁹ × 0.05 = 50,000,000 bits (6.25 MB).
A sender must be allowed to have this much unacknowledged data to keep the link busy; this is why TCP window size matters (Unit 5).
If a link of rate R is shared fairly by k users, each gets R / k. A file of F bits over a path with bottleneck R' and round-trip time T takes about F / R' + T (plus set-up round trips). For small files the round trips dominate; for large files the rate does.
1.9 Standards and organisations
| Body | Role |
|---|---|
| ISO | OSI reference model |
| ITU-T | telecom standards (G., V., X. series), including DSL and fibre |
| IEEE | LAN standards: 802.3 Ethernet, 802.11 Wi-Fi, 802.1Q VLAN |
| IETF | Internet standards as RFCs: IP (RFC 791), TCP (RFC 9293), HTTP (RFC 9110) |
| IANA / ICANN | numbers (IP blocks, ports) and names (DNS root) |
| W3C | web standards (HTML, CSS) |
In Nepal the Nepal Telecommunications Authority (NTA) licenses ISPs and telecom operators, and the Nepal Telecom and private ISPs provide Internet access over fibre, wireless and mobile networks.
Practising the commands
The following program uses only the Python standard library to build a miniature layered stack: it wraps an application message in a transport header, a network header and a frame header, and then unwraps it. It shows encapsulation as plain data.
msg = b"HELLO"
tcp = b"[TCP sport=5000 dport=80]" + msg
ip = b"[IP src=10.0.0.5 dst=93.184.216.34]" + tcp
frame = b"[ETH dst=aa:bb src=cc:dd]" + ip + b"[FCS]"
print(len(msg), len(tcp), len(ip), len(frame))
for name in ("[ETH", "[IP", "[TCP"):
    start = frame.index(name.encode()); end = frame.index(b"]", start) + 1
    print(name + "…]", frame[start:end].decode())
print(frame.decode())
5 30 65 95
[ETH…] [ETH dst=aa:bb src=cc:dd]
[IP…] [IP src=10.0.0.5 dst=93.184.216.34]
[TCP…] [TCP sport=5000 dport=80]
[ETH dst=aa:bb src=cc:dd][IP src=10.0.0.5 dst=93.184.216.34][TCP sport=5000 dport=80]HELLO[FCS]
1.10 Seeing the ideas: networks, topologies, layers and delay
A network is cables, boxes and rules.
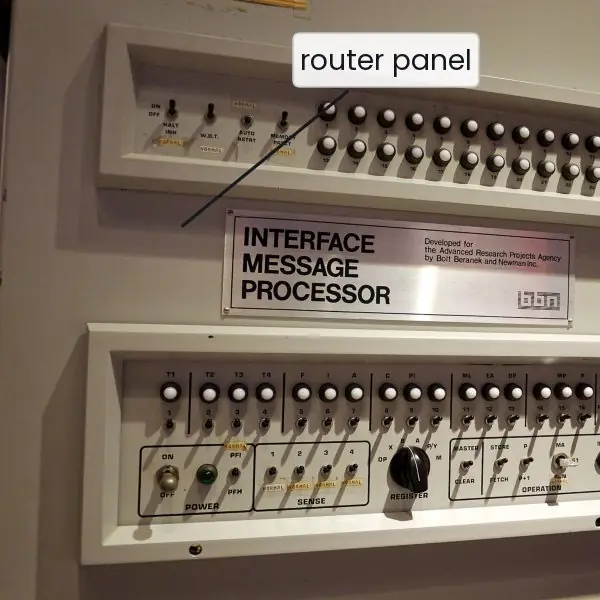
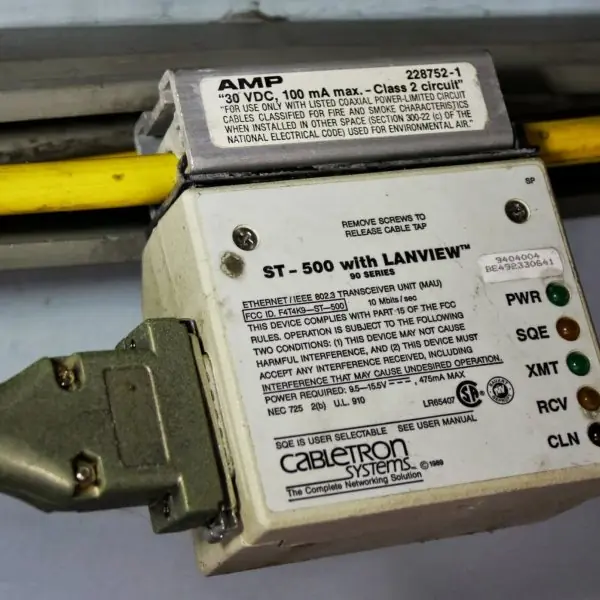
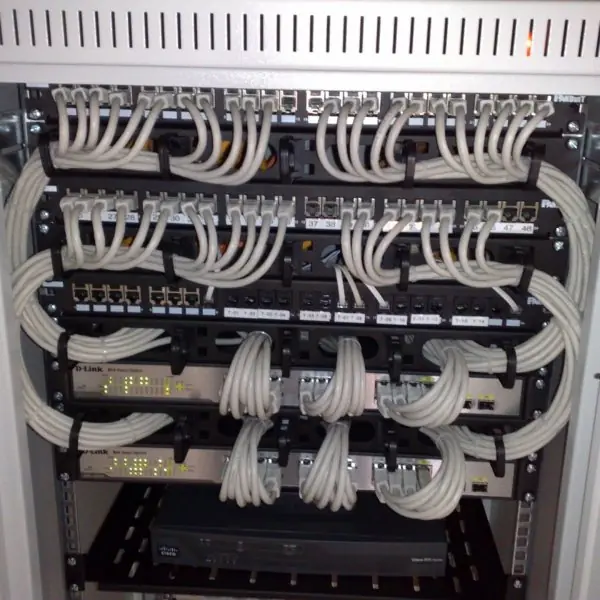
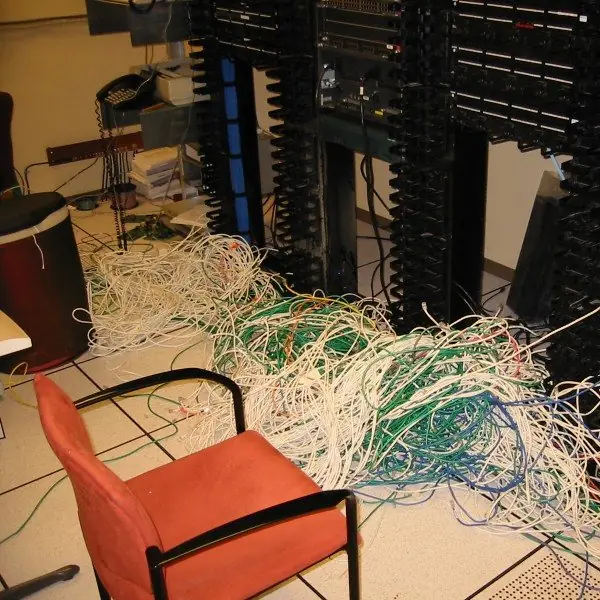
Plate 1.1 shows real pieces of that story: the first ARPANET router, a thick Ethernet bus with a transceiver tapped into it, a tidy wiring rack where every cable ends at a switch, and the tangle that results when nobody plans the cabling.
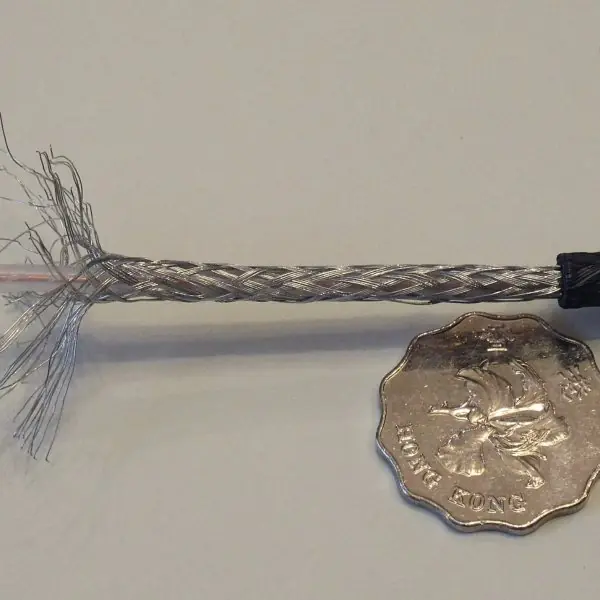
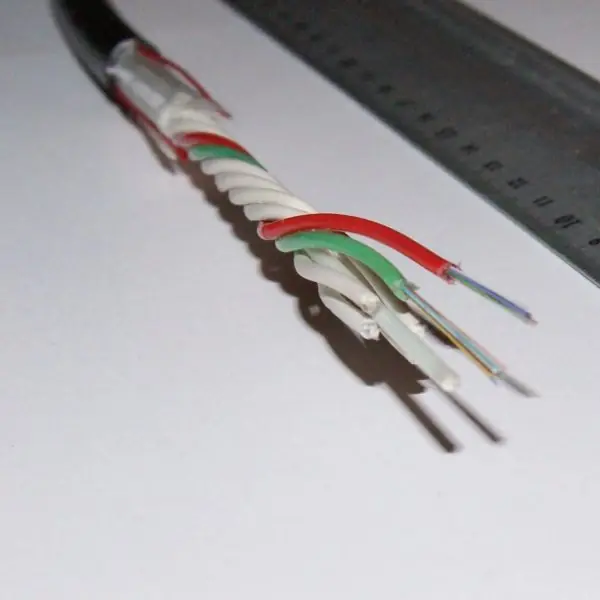
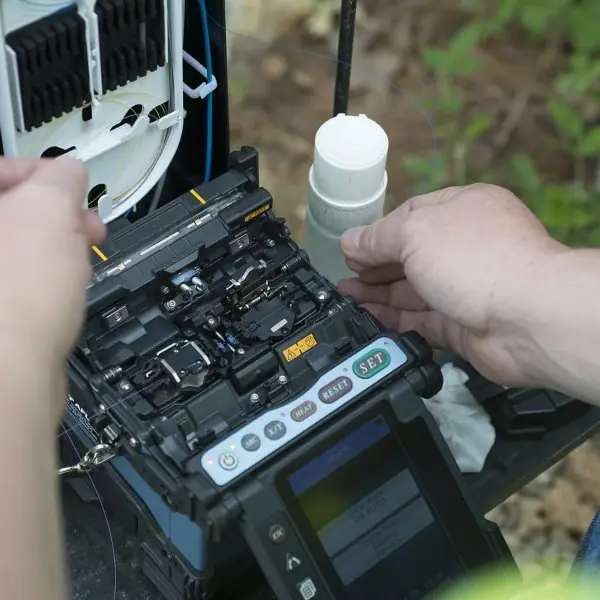
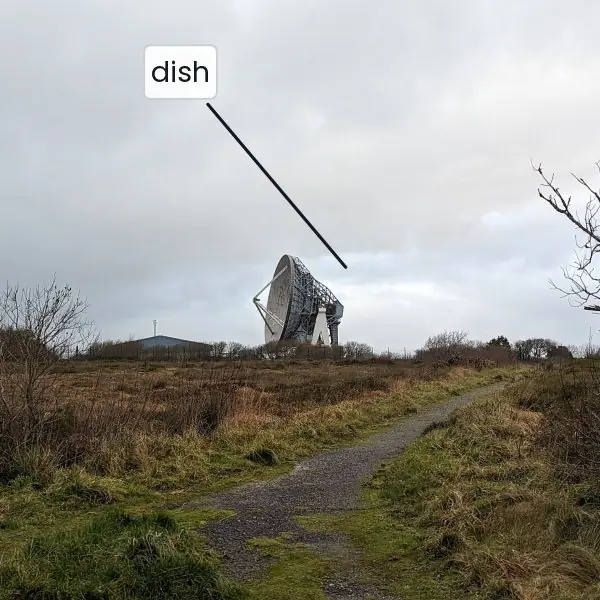
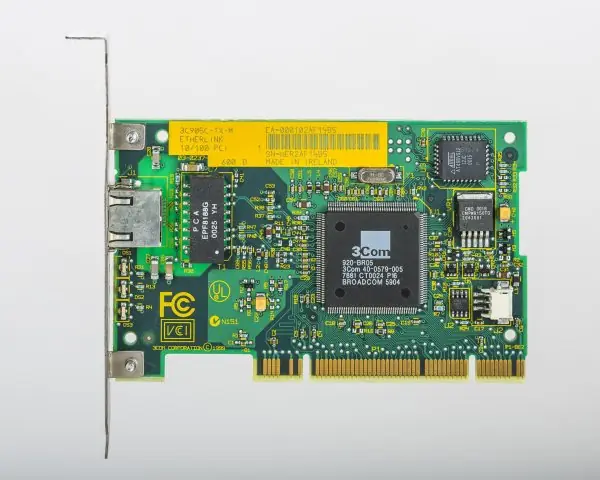
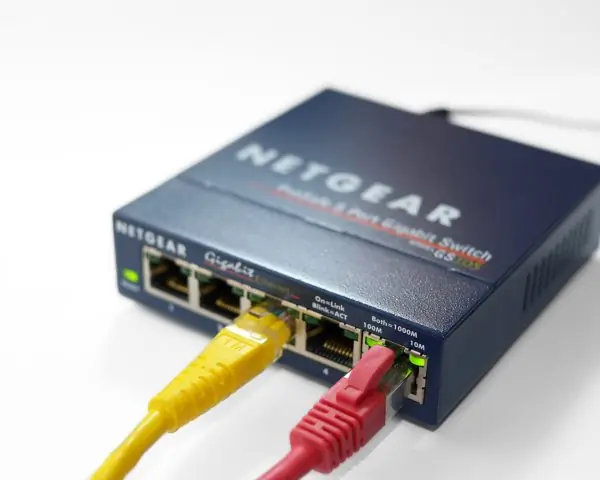
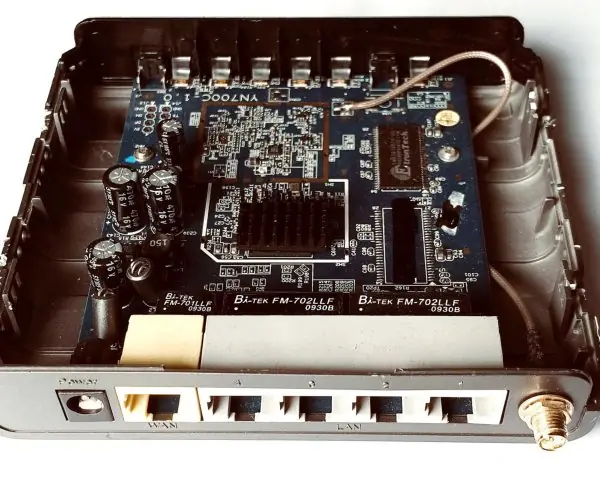
Plate 1.2 shows four kinds of link (coaxial, optical fibre with a fusion splicer at work, and a satellite earth station), and Plate 1.3 shows the three boxes that students meet first: the network card, the switch and the router.
The figures then draw the span of PAN, LAN, MAN and WAN to scale, the five topologies with their link counts, the growth of a full mesh, the two layered models side by side, the headers wrapped around a frame to scale, and the delay components of a real link.


1.10.1 Eight uses of computer networks in Nepal
- Banking and payments. Mobile wallets, ConnectIPS and Fonepay QR payments all send small messages between your phone, a payment switch and a bank, and every message must arrive correctly and quickly. A reliable network lets a shopkeeper in Pokhara receive money from a customer in Kathmandu in seconds. The topics of this unit (layers, delay and throughput) decide how fast and how safe that payment feels.
- Education. Universities such as Tribhuvan University publish results and run admission and examination portals over the Internet, and colleges run campus LANs with Wi-Fi in labs and libraries. Online classes became common when schools closed, and they needed enough bandwidth for video (Fig. 1.7). A network lets one good teacher reach students in many districts.
- Government services. The Nagarik App and online portals for passports, driving licences and company registration let citizens apply without travelling to a district office. Each service is a client-server system behind a data centre. A MAN or WAN links the offices to the data centre, so the topology and the link capacity decide how many people it can serve.
- Communication. Mobile operators and ISPs carry voice, SMS, messaging and video calls on networks of fibre, microwave and radio links. Voice calls need low delay, while file downloads need high throughput, so one network must serve both (Fig. 1.6). A national fibre backbone ties towns together and connects Nepal to the global Internet through its neighbours.
- Health care. Hospitals share patient records, X-ray images and laboratory results over a LAN, and district health posts report to the national health information system. Telemedicine lets a doctor in the city examine a patient by video from a hill-district clinic. A star topology with a managed switch in each hospital keeps one broken cable from stopping the whole ward (Fig. 1.2).
- Commerce and online shopping. Online shops such as Daraz and small Facebook sellers depend on web servers, payment links and delivery tracking. Networks also connect the branches of a retail chain to one stock database. Every web page request passes through all the layers of the TCP/IP stack (Fig. 1.4) before the buyer sees the product.
- Remote work and outsourcing. Many Nepali developers and designers work for foreign clients over the Internet, using video calls, cloud tools and secure tunnels. The delay of a long link, mostly propagation delay, is fixed by distance, but the user can still choose a good ISP and avoid congestion (Fig. 1.6). A stable network is the main tool of the job.
- Monitoring and safety. Hydropower stations, weather stations and flood-warning sensors send readings over radio, mobile or satellite links to a control room (Plate 1.2d). Early flood warning for a river needs reliable delivery of a few bytes, not a high speed. Small packets carry a high overhead (Fig. 1.5), but for an alarm that does not matter, because the message is short and urgent.
Formula and fact sheet
- Transmission delay = L / R; propagation delay = d / s with s ≈ 2 × 10⁸ m/s in cable and fibre.
- Store and forward over N equal links: N × L / R for one packet; (N + P − 1) × L / R for P packets of L bits pipelined.
- BDP = rate × delay. Full mesh links = n(n − 1)/2.
- OSI layers (top to bottom): Application, Presentation, Session, Transport, Network, Data link, Physical. TCP/IP: Application, Transport, Internet, Link.
- Data units: bit, frame, packet, segment (datagram for UDP), message.
Chapter summary
- A network moves data between hosts using agreed protocols, addresses and media. LAN, MAN and WAN differ by span; the Internet is a network of networks.
- Topology affects cost and reliability; today's LANs are physical stars built around switches.
- Layering divides the work: each layer serves the one above and talks to its peer. OSI has seven layers, TCP/IP four.
- Data is encapsulated on the way down and decapsulated on the way up; headers are overhead.
- Latency = transmission + propagation + queuing + processing; BDP tells how much data fills the pipe.
Practice
- Define protocol and explain syntax, semantics and timing.
- Compare LAN, MAN and WAN with one example each.
- A full mesh joins 12 computers. How many links and how many ports per computer?
- List the seven OSI layers and give the data unit and one protocol for layers 2, 3 and 4.
- State two differences between the OSI and TCP/IP models.
- A frame carries 1460 bytes of application data with TCP, IPv4 and Ethernet headers (18 bytes of header and trailer). How many bytes does it occupy and what fraction is payload?
- A 1500-byte packet crosses one 100 Mbps, 2000 km link. Find the transmission and propagation delays.
- A 10⁶-bit message crosses 3 links of 1 Mbps. Compare sending it whole with sending it as 1000 packets of 1000 bits.
- Compute the bandwidth–delay product of a 1 Gbps link with 50 ms delay.
- Distinguish a hub, a switch and a router in terms of collision and broadcast domains.
Answers and worked solutions
1. A protocol is the set of rules for communication between peer entities. Syntax: message format and field sizes. Semantics: the meaning of fields and the actions to take. Timing: when and how fast to send and what to do on delay.
2. LAN: a college lab on Ethernet. MAN: a city-wide cable or fibre network of an ISP. WAN: an ISP backbone or the Internet. They differ by span (metres to kilometres to continents), ownership and speed.
3. 12 × 11 / 2 = 66 links; each computer has 11 ports.
4. Layer 2 data link: frame, Ethernet. Layer 3 network: packet, IP. Layer 4 transport: segment, TCP (UDP: datagram).
5. OSI has seven layers and a clean service/interface/protocol split but few real implementations; TCP/IP has four layers, grew from protocols, and is what the Internet runs. OSI layer 3 offers both connection modes, TCP/IP's Internet layer only connectionless.
6. 1460 + 20 + 20 + 18 = 1518 bytes; payload fraction 1460 / 1518 = 96.2 %.
7. Transmission 12,000 / 10⁸ = 0.12 ms; propagation 2 × 10⁶ / (2 × 10⁸) = 10 ms.
8. Whole: 3 × 10⁶ / 10⁶ = 3 s. Packetised: 3 ms + 999 × 1 ms = 1.002 s.
9. 10⁹ × 0.05 = 50,000,000 bits = 6.25 MB.
10. Hub: one collision domain and one broadcast domain for all ports. Switch: each port its own collision domain, still one broadcast domain (without VLANs). Router: each interface its own collision and broadcast domain.
Model answers for Unit 1
Q1. Classify networks by size and compare the common network topologies. (10 marks)
Introduction. A computer network is a set of autonomous hosts joined by links so that they can exchange data. Networks are classified by the distance they span, and their shape, called the topology, decides cost, reliability and how easily they grow.
Types of network (Fig. 1.1).
| Type | Span | Technology | Example |
|---|---|---|---|
| PAN | a few metres | Bluetooth, USB | phone and earbuds |
| LAN | a room to a campus | Ethernet, Wi-Fi | college computer lab |
| MAN | a city | fibre rings, metro Ethernet | ISP network of the Kathmandu valley |
| WAN | a country to the world | leased lines, submarine cable, satellite | an ISP backbone, the Internet |
A LAN is owned by one organisation, runs at 100 Mbps to 10 Gbps and has few errors. A WAN crosses public land, so it rents capacity from carriers and has long delays.
Topologies (Fig. 1.2).
| Topology | Links for n nodes | Strength | Weakness |
|---|---|---|---|
| Bus | 1 shared cable | cheap, little cable | one break stops all, collisions |
| Star | n | easy to add nodes, a fault stays local | the centre is a single point of failure |
| Ring | n | orderly access by token | one break stops a single ring |
| Full mesh | n(n - 1)/2 | very reliable, many paths | cabling grows very fast |
| Tree | n - 1 | scales in levels | depends on the root |
| Hybrid | varies | fits a real building | more complex |
Growth of a mesh. For 10 nodes a full mesh needs 10 x 9 / 2 = 45 links and 9 ports per node, and for 20 nodes it needs 190 links (Fig. 1.3). A star needs only 10 or 20 links, so a full mesh is used only for a few core routers.
Modern practice. Almost every LAN is a physical star: all cables run to a switch in a rack (Plate 1.1c), even if the network behaves like a bus or ring in logic. The old thick Ethernet bus (Plate 1.1b) was replaced because one bad tap could stop the whole network.
Conclusion. Size decides the technology and ownership, while topology decides cost and failure behaviour. The star is the practical choice for LANs, the mesh for the core and the tree for large organisations.
Q2. Explain the seven layers of the OSI reference model with the function and protocols of each layer. (10 marks)
Introduction. The OSI model of ISO divides communication into seven layers, each using the services of the layer below and offering services to the layer above (Fig. 1.4).
Layering lets each part change without breaking the others and gives engineers a common vocabulary.
The layers, from the top.
| Layer | Function | Data unit | Examples |
|---|---|---|---|
| 7 Application | services to the user program | message | HTTP, DNS, SMTP, FTP |
| 6 Presentation | encoding, compression, encryption | message | TLS, JPEG, ASCII and Unicode |
| 5 Session | opens, manages and closes dialogs, checkpoints | message | session control, RPC |
| 4 Transport | end-to-end delivery, ports, reliability, flow control | segment or datagram | TCP, UDP |
| 3 Network | logical addressing, routing across networks | packet | IP, ICMP, routers |
| 2 Data link | framing, MAC addressing, error detection, access to the medium | frame | Ethernet, Wi-Fi, switches |
| 1 Physical | bits as signals on the medium | bits | cables, hubs, connectors |
How it works. The sender's data moves down the stack, each layer adding a header (encapsulation, Fig. 1.5). The bits cross the medium, and at the receiver each layer removes its header and passes the data up.
Peer layers on the two hosts talk by protocols, but physically only the physical layers touch the medium.
Devices. A hub works at layer 1 and repeats bits; a switch works at layer 2 and forwards frames by MAC address; a router works at layer 3 and forwards packets by IP address (Plate 1.3).
Worked example. When a student opens a college result page, the browser (layer 7) makes an HTTP request; TLS encrypts it (6); the session stays open while the page loads (5); TCP splits the request into segments with port numbers (4); IP adds the server's address (3); Ethernet or Wi-Fi frames it with MAC addresses (2); and the signal leaves the card as bits (1).
The server reverses the steps on arrival.
Remembering the order. "Please Do Not Throw Sausage Pizza Away" gives Physical to Application from the bottom.
Conclusion. OSI is a teaching and design model. Real networks use the simpler TCP/IP stack, but the seven names are still used to locate a fault ("a layer 2 problem") and to describe a device.
Q3. Compare the OSI model with the TCP/IP model. (5 marks)
The TCP/IP model has four layers: Application, Transport, Internet and Link. It was designed with the protocols, while OSI was designed as a general model before its protocols existed (Fig. 1.4).
| Point | OSI | TCP/IP |
|---|---|---|
| Layers | 7 | 4 |
| Top layers | application, presentation, session | one application layer |
| Bottom layers | data link, physical | one link layer |
| Origin | ISO, a reference model first | US research network, protocols first |
| Use | teaching and vocabulary | the working Internet |
| Transport service | connection-oriented and connectionless in some forms | TCP (reliable) and UDP (fast) |
| Strict layering | strong | looser, layers may be bypassed |
Example. A web page uses HTTP at the application layer, TCP at transport, IP at the Internet layer and Ethernet at the link layer, four protocols for four layers.
Mapping. OSI layers 5 to 7 map to the TCP/IP Application layer, 4 to Transport, 3 to Internet and 1 and 2 to Link. Why TCP/IP won. It was running and free, it was simple, and the Internet grew on it.
Why OSI is still taught. Its layer names are universal: engineers speak of layer 2 switches and layer 3 routers.
Q4. A 1500 byte packet crosses a 2000 km link of 10 Mbps. Calculate the transmission delay, the propagation delay and the bandwidth-delay product. (5 marks)
Formulas. Transmission delay dT = L / R, the time to push all bits onto the link. Propagation delay dP = d / s, the time for one bit to travel, where the signal speed s is about 2 x 10^{8} m/s in fibre or copper.
The total delay on a hop also includes processing and queuing delay.
Calculation (Fig. 1.6).
- L = 1500 x 8 = 12 000 bits and R = 10 Mbps = 10 000 000 bits/s.
- dT = 12 000 / 10 000 000 = 0.0012 s = 1.2 ms.
- dP = 2 000 000 m / (2 x 10^{8} m/s) = 0.01 s = 10 ms.
- Total, ignoring queuing and processing: 1.2 + 10 = 11.2 ms for the last bit to arrive.
- Bandwidth-delay product = R x dP = 10 Mbps x 10 ms = 100 000 bits = 12.5 kB, the amount of data "in flight" on the link.
Comparison. For a LAN of 100 m at 1 Gbps, dT = 12 us and dP = 0.5 us, so transmission dominates. On the long WAN propagation dominates. A faster router cannot shorten propagation; only a shorter path can.
Q5. Explain encapsulation and calculate the efficiency of a full Ethernet frame and of a small one. (5 marks)
Encapsulation. As data goes down the stack, each layer adds its own header (and the data link layer also a trailer).
Application data becomes a TCP segment with a 20 byte header, then an IP packet with a 20 byte header, then an Ethernet frame with a 14 byte header and a 4 byte trailer (the frame check sequence, FCS).
The receiver removes the headers in the opposite order, which is decapsulation (Fig. 1.5).
Calculation. The overhead is 14 + 20 + 20 + 4 = 58 bytes per frame.
| Data | Frame | Efficiency |
|---|---|---|
| 1460 bytes (full segment) | 1518 bytes | 1460 / 1518 = 96.2 percent |
| 536 bytes | 594 bytes | 536 / 594 = 90.2 percent |
| 100 bytes | 158 bytes | 100 / 158 = 63.3 percent |
| 20 bytes | 78 bytes | 20 / 78 = 25.6 percent |
Meaning. The 58 bytes are a fixed cost per packet, so small packets waste capacity. Bulk transfers use full segments, while an alarm message of a few bytes accepts the overhead because it is short and urgent.
Headers carry what each layer needs: ports at transport, IP addresses at network, MAC addresses at data link.
Q6. Define bandwidth, throughput and latency. A path has links of 100, 10 and 50 Mbps. Find the throughput and the time to send a 100 MB file. (5 marks)
Definitions. Bandwidth is the maximum rate of a link in bits per second. Throughput is the rate actually achieved end to end, and it can never exceed the slowest link on the path.
Latency is the time for data to get from one end to the other, made of transmission, propagation, queuing and processing delays.
Calculation (Fig. 1.7).
- The throughput of a path is the minimum link rate: min(100, 10, 50) = 10 Mbps.
- The file is 100 MB = 100 x 8 = 800 Mbit.
- Time = 800 Mbit / 10 Mbps = 80 s.
- Upgrading the 100 Mbps link does nothing, because the bottleneck is the 10 Mbps link.
- Upgrading the bottleneck to 50 Mbps makes the minimum 50 Mbps and the time 800 / 50 = 16 s, five times faster.
Lesson. Find the bottleneck first. A user may blame the "slow Internet" while the real limit is the Wi-Fi link, the school's uplink or the server.
Throughput is also reduced by protocol overhead (Fig. 1.5), by queuing during congestion and by the sender's window on long paths.