Unit 1 · 5 teaching hours · 17 min read
Introduction and Graphics Hardware
What the syllabus asks for 5
- Applications and areas
- Display devices
- The frame buffer and its arithmetic
- The graphics pipeline and the GPU
- Seeing the ideas: pixels, tubes, tables and the pipeline
Every image on a screen, whether a game, a map, a Nepali newspaper page or the cursor you are watching, is a grid of coloured dots whose values were computed by a program.
Computer graphics is the discipline of computing those values: starting from a description of a scene (shapes, positions, materials, lights) and producing an image (a block of numbers in memory that the display hardware turns into light).
This unit introduces what graphics is used for, how displays and memory organise an image, and does the arithmetic that sizes a frame buffer.
The remaining units then follow the graphics pipeline, from lines and circles to transformations, clipping, 3D viewing, shading, curves and animation.
- Applications and the main areas of graphics: modelling, rendering, animation, image processing.
- Raster-scan and vector displays; pixels, resolution, aspect ratio, colour depth, look-up tables.
- Frame-buffer size, refresh bandwidth and timing calculations.
- The graphics pipeline and the roles of the GPU and of graphics software standards.
1.1 Applications and areas
Graphics is everywhere: user interfaces (windows, icons, touch gestures), computer-aided design (CAD) of buildings, machines and circuits, scientific and information visualisation (weather maps, charts, medical scans), games and entertainment (film effects, real-time 3D), simulation and training (flight and driving simulators), virtual and augmented reality, cartography and GIS (a municipality's ward map), education and art and typography (rendering Devanagari fonts).
The field divides into four closely related areas.
| Area | Question it answers | Example |
|---|---|---|
| Modelling | How do we describe shapes mathematically? | A mesh of triangles for a temple; a Bézier curve for a letter |
| Rendering | How do we turn a model into a 2D image? | Projection, hidden-surface removal, lighting |
| Animation | How do we make the image change over time? | Keyframes, interpolation, physics |
| Image processing / computer vision | How do we analyse or improve an existing image? | Blur, edge detection, face detection (the reverse of rendering) |
Interactive graphics (a game) must produce a new image 30 to 120 times a second; offline rendering (a film) may spend hours on a single frame. The same mathematics serves both.
1.2 Display devices
Raster-scan displays
Most displays today are raster devices. The image is a rectangular array of picture elements, pixels, each holding a colour value. The hardware reads the array row by row (scan lines), top to bottom, and sends each value to the screen.
The classic cathode-ray tube (CRT) swept an electron beam across the phosphor, with a horizontal retrace at the end of each line and a vertical retrace at the end of each frame; modern LCD and OLED panels address pixels electronically but the same scanning model and terminology survive.
Rasters are good at filled areas and continuous colour, and are the basis of photographs, video and 3D rendering.
The cost is the memory needed and the "jaggies": a line that is not horizontal or vertical must be approximated by pixels (the staircase or aliasing effect), which is why Unit 2 exists.
Random-scan (vector) displays
A vector display (random-scan, calligraphic) draws only the lines of a picture, directing the beam from endpoint to endpoint according to a display list of drawing commands.
It gives smooth, sharp lines with little memory, but cannot fill areas with arbitrary colour and flickers when the list is long.
It survives as an idea in plotters and in vector formats such as SVG, where a drawing is a list of shapes that is rasterised only when displayed.
The difference matters daily: a vector logo scales to any size without blur, a raster image does not.
| Raster scan | Random scan (vector) | |
|---|---|---|
| Stores | Colour of every pixel | List of lines and commands |
| Memory | Large (width × height × depth) | Small |
| Refresh | Fixed rate, independent of content | Depends on the number of lines |
| Filled areas, photos | Excellent | Poor |
| Lines | Aliased (staircase) | Smooth |
| Scaling | Blurry or blocky | Perfect |
| Typical use | Monitors, TV, phones | Plotters, laser light shows, SVG |
Colour, resolution and aspect ratio
Resolution is the number of pixels horizontally × vertically (1920 × 1080); pixel density is pixels per inch.
Colour depth (bits per pixel) determines how many colours can be shown: 1 bit gives 2 (black and white), 8 bits give 256, and true colour uses 24 bits (8 each for red, green and blue) giving 2²⁴ = 1,67,77,216 colours; a fourth 8-bit channel (alpha, for transparency) gives 32 bits.
The aspect ratio is width : height; 1920 × 1080 reduces to 16:9 (widescreen), and a mismatch between image and screen aspect ratios causes stretching or black bars.
Colour on displays is made by additive mixing of red, green and blue light (RGB), while printers use subtractive cyan, magenta, yellow and black (CMYK).
The HSV/HSL models describe the same colours by hue, saturation and value, which is more intuitive for pickers.
1.3 The frame buffer and its arithmetic
The frame buffer (video memory) holds the colour of every pixel; the video controller reads it continuously and drives the display. Its size is
size (bytes) = width × height × bits per pixel ÷ 8.
- 640 × 480 at 8 bits: 640 × 480 = 3,07,200 pixels, so the buffer is 3,07,200 bytes.
- 1920 × 1080 at 24 bits: 20,73,600 pixels × 3 bytes = 62,20,800 bytes (5.93 MiB).
- 3840 × 2160 (4K) at 32 bits: 3,31,77,600 bytes (31.64 MiB), four times the pixels of full HD.
Refresh bandwidth. To redraw 1920 × 1080 at 24 bits sixty times a second the controller must read 62,20,800 × 60 = 37,32,48,000 bytes per second (373.2 MB/s), and, because the buffer is rewritten by the processor too, memory bandwidth is a real constraint.
Timing: one frame lasts 1/60 s; with 1080 lines, one scan line takes about 15.43 µs, and each pixel about 8.04 ns, so the pixel clock exceeds 124 MHz (more once blanking intervals are added).
Look-up tables (colour palettes). To save memory on old displays, each pixel stores an index (8 bits) into a colour look-up table (LUT) of 256 entries of 24-bit colours (256 × 24 = 6144 bits of table).
A 1024 × 768 image then needs 7,87,200 bytes (the indices plus the 768-byte table) instead of 23,59,296 bytes in true colour, a saving of 15,72,096 bytes, at the cost of only 256 simultaneous colours.
Palette tricks survive in GIF and PNG-8 images.
Double buffering. If the program draws into the buffer being displayed, the viewer sees half-drawn frames (flicker and tearing).
Double buffering draws the next frame into a back buffer and swaps it with the front buffer during the vertical retrace, which is why graphics libraries have a "swap buffers" call.
A depth buffer (Unit 6) adds a second per-pixel array of depth values.
1.4 The graphics pipeline and the GPU
A renderer for 3D scenes performs a sequence of stages, the graphics pipeline; the units of this book follow it.
- Modelling: objects are defined in their own coordinates (Units 3, 5, 7).
- Modelling transformation: place each object in the world (Unit 3, 5).
- Viewing transformation: express the world relative to the camera (Unit 5).
- Projection: reduce 3D to 2D (Unit 5).
- Clipping: discard what lies outside the view (Unit 4).
- Viewport mapping: scale to screen coordinates (Unit 3).
- Rasterisation (scan conversion): turn lines and polygons into pixels (Unit 2).
- Visibility and shading: decide which surface is seen and compute its colour (Unit 6).
- Display: write to the frame buffer.
A graphics processing unit (GPU) is a processor with thousands of simple cores that run the same program on many vertices or pixels at once (data parallelism); programmable vertex shaders and fragment (pixel) shaders replaced the fixed-function pipeline.
Programmers reach it through APIs such as OpenGL, Vulkan, DirectX and Metal (and WebGL in browsers); older textbooks use a simple library such as the Graphics Library of the C language. The principles are unchanged.
1.5 Seeing the ideas: pixels, tubes, tables and the pipeline
Every picture a computer shows is made of tiny coloured cells.
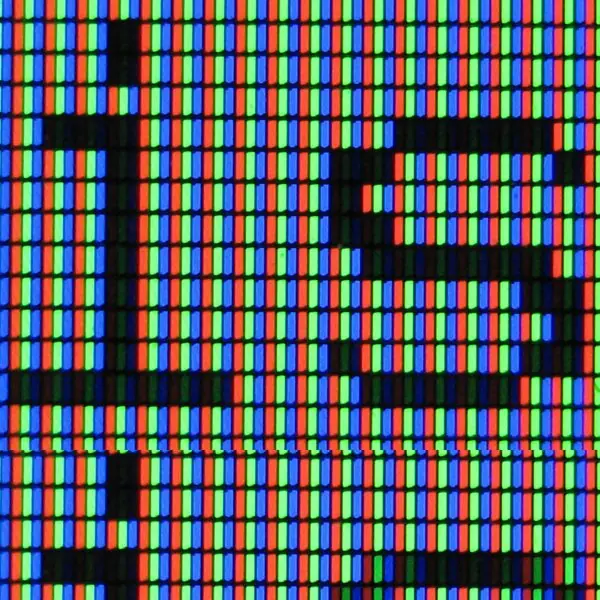
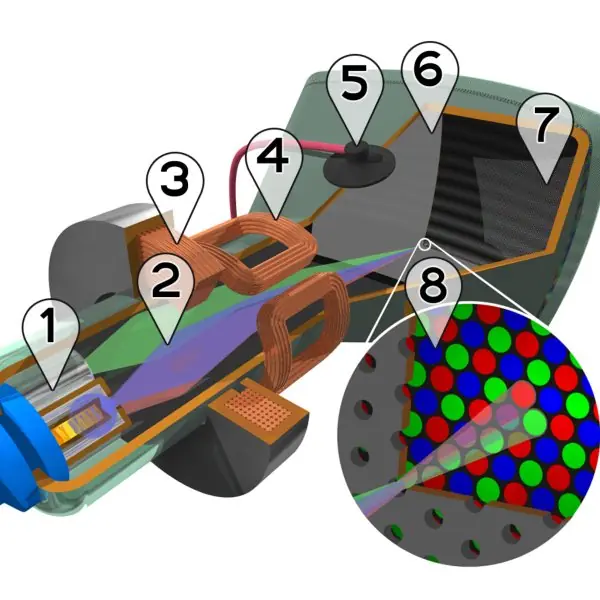
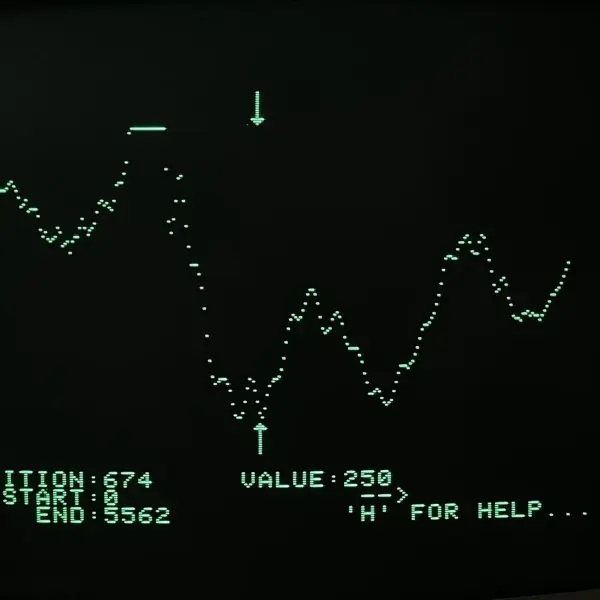
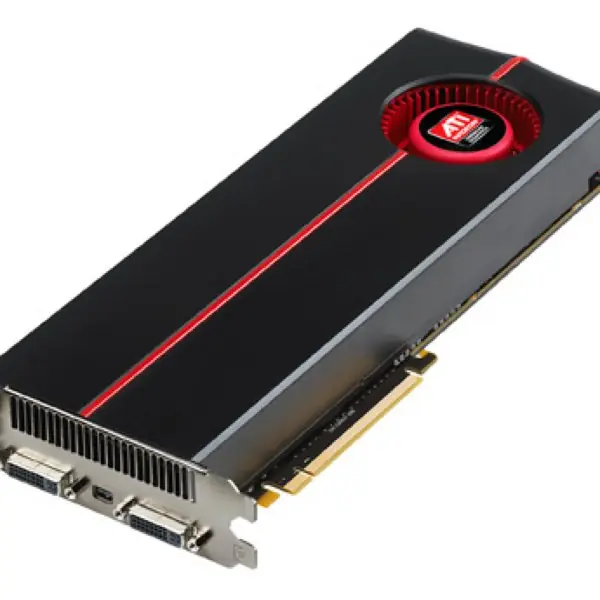
Plate 1.1 shows the real hardware behind the words of this unit: an LCD magnified until its red, green and blue sub-pixels are visible, the colour picture tube that raster scanning was invented for, an early green vector-style monitor, and a modern graphics card that fills the frame buffer.


1.5.1 Eight applications of computer graphics
- User interfaces. Every window, icon and touch gesture on a phone is drawn by graphics routines. A clear screen makes services such as ConnectIPS and Fonepay easier to use. Good graphics reduce errors and training time.
- CAD and engineering design. Engineers draw bridges, buildings and circuit boards on screen before anything is built. A civil engineer in Kathmandu tests a drawing for a hill road without spending on a model. Changes are cheap and exact.
- Visualisation of data. Charts, weather maps and flood maps turn numbers into pictures. The Department of Hydrology and Meteorology shows rainfall as colours on a map. People understand risk faster from a picture.
- Medical imaging. CT and MRI scans are stacks of slices that graphics turns into 3D views. A doctor can rotate an organ and plan surgery. Hospitals such as TUTH depend on this for diagnosis.
- Games and entertainment. Games redraw the screen 30 to 120 times a second using the GPU. Animated films and music videos use the same mathematics offline. Nepali studios use it for advertisements and film effects.
- Education and simulation. Pilots, drivers and students practise safely on simulators. A virtual chemistry lab shows a reaction that is too dangerous to try. Learning by seeing is faster and safer.
- Maps and navigation. Map apps draw roads, traffic and routes from vector data. Ride apps like Pathao show where the rider is on screen. Fast zooming needs efficient clipping and scaling.
- Digital art and publishing. Posters, logos and fonts are drawn with vector curves that scale without loss. Newspapers and textbooks, including this one, depend on vector and raster graphics. Quality printing needs correct resolution.
Chapter summary
- Graphics covers modelling, rendering, animation and image processing; applications range from CAD to games to maps.
- Raster displays store every pixel and give filled colour images with aliasing; vector displays store lines and scale perfectly.
- Frame-buffer size = width × height × bits ÷ 8: 1920 × 1080 × 24 bits needs 62,20,800 bytes and about 373.2 MB/s at 60 Hz.
- A look-up table trades colour range for memory; double buffering prevents flicker.
- The pipeline runs from modelling through viewing, projection, clipping and rasterisation to display, and GPUs execute it in parallel.
Practice
- Name four applications of computer graphics and the area (modelling, rendering, animation, image processing) each emphasises.
- Differentiate raster-scan and random-scan displays.
- Compute the frame-buffer size for 1280 × 720 at 24 bits per pixel.
- How many bytes does an 800 × 600 image with an 8-bit palette need, including a 256-entry 24-bit table?
- How many colours can 15-bit colour (5 bits per channel) represent?
- Reduce 1366 × 768 to its aspect ratio (approximately) and say whether it is wider or narrower than 4:3.
- Explain how a colour look-up table saves memory.
- Why is double buffering used?
- List the stages of the graphics pipeline in order.
- Why are vector formats such as SVG preferred for logos?
Answers and worked solutions
1. CAD (modelling); film effects (rendering and animation); medical scans (visualisation/image processing); GIS maps (modelling and rendering).
2. Raster scan stores the colour of every pixel and refreshes at a fixed rate (good for filled areas, aliased lines); random scan draws only lines from a display list (smooth lines, little memory, poor fills).
3. 1280 × 720 × 3 = 27,64,800 bytes (2.64 MiB).
4. 800 × 600 = 4,80,000 bytes of indices + 768 bytes of table = 4,80,768 bytes.
5. 2¹⁵ = 32,768 colours.
6. 1366/768 = 1.779, close to 16:9 (1.778); wider than 4:3 (1.333).
7. Each pixel stores a short index (8 bits) instead of a full 24-bit colour; the full colours are stored once in the table.
8. To draw the next frame off-screen and swap during the vertical retrace so that half-drawn frames are never shown.
9. Modelling, modelling transform, viewing transform, projection, clipping, viewport mapping, rasterisation, visibility and shading, display.
10. Vector graphics are resolution-independent: they scale without blur and have small files.
Model answers: medium (5 marks) and long (10 marks) questions
Q1 (5 marks). Differentiate raster-scan and random-scan displays with a diagram and give uses of each.
Introduction. A display system must decide how the beam or the pixels are addressed. In raster scan the whole screen is swept line by line; in random scan only the lines of the picture are drawn (section 1.2, Figure 1.1).
- Storage. Raster stores the colour of every pixel in a frame buffer; random scan stores a short list of line commands (display list).
- Refresh. Raster refreshes at a fixed rate (for example 60 Hz) whatever the content; random scan refresh time grows with the number of lines.
- Quality. Raster shows filled areas and photographs well but lines have staircases; random scan draws smooth lines but cannot fill areas.
- Scaling. A raster image becomes blocky when enlarged; a line drawing scales perfectly.
- Cost and use. Raster is cheap and universal (monitors, TVs, phones); random scan survives in plotters, laser shows and vector formats such as SVG.
| Point | Raster scan | Random scan |
|---|---|---|
| Stores | Every pixel | List of lines |
| Memory | Large | Small |
| Filled areas | Excellent | Poor |
| Lines | Aliased | Smooth |
| Use | Monitors, phones | Plotters, laser shows |
Conclusion. Raster scan dominates because modern pictures are full of colour and filled shapes; random scan ideas live on in vector graphics.
Q2 (5 marks). A 1280 x 720 display uses 24 bits per pixel and is refreshed 60 times a second. Find the frame-buffer size and the refresh bandwidth. How much memory would an 8-bit look-up-table version need?
Introduction. The frame buffer holds one value for every pixel; its size follows from the resolution and colour depth (section 1.3, Figure 1.2).
Frame buffer. Pixels = 1280 x 720 = 9,21,600. Size = 9,21,600 x 24 / 8 = 9,21,600 x 3 = 27,64,800 bytes (2.64 MiB).
Refresh bandwidth. 27,64,800 x 60 = 16,58,88,000 bytes per second (165.9 MB/s). The video controller must read this much memory every second, in addition to what the processor writes.
Look-up table version. With 8 bits per pixel the indices need 9,21,600 bytes and the table of 256 entries x 3 bytes needs 768 bytes: total 9,22,368 bytes, about one third of the true-colour buffer, but only 256 colours can appear at once.
| Version | Memory (bytes) |
|---|---|
| 24-bit true colour | 27,64,800 |
| 8-bit with LUT | 9,22,368 |
Conclusion. True colour costs three times the memory of an indexed palette but removes the 256-colour limit.
Q3 (10 marks). Explain the graphics pipeline. Describe each stage, the role of the GPU and the frame buffer, and show how the units of this subject fit into it.
Introduction. A 3D scene is turned into a 2D picture by a fixed sequence of operations called the graphics pipeline. Each stage takes the output of the previous one (section 1.4, Figure 1.3).
Stages.
- Modelling: objects are described in their own coordinates, as meshes or curves (Units 5, 7).
- Modelling transformation: each object is placed in the world by scaling, rotating and translating (Units 3, 5).
- Viewing transformation: the world is expressed relative to the camera (Unit 5).
- Projection: 3D coordinates are reduced to 2D, by parallel or perspective projection (Unit 5).
- Clipping: everything outside the view volume is discarded (Unit 4).
- Viewport mapping: window coordinates are scaled to screen pixels (Unit 3).
- Rasterisation: lines and polygons become pixels, using DDA, Bresenham and fill algorithms (Unit 2).
- Visibility and shading: hidden surfaces are removed and each visible pixel receives a colour (Unit 6).
- Display: the result is written to the frame buffer, which the video controller sends to the screen (Unit 1).
The GPU. A graphics processing unit has thousands of simple cores that run the same program on many vertices or pixels at once. Programmable vertex shaders handle stages 2 to 4 and fragment shaders handle stage 8, reached through APIs such as OpenGL and Vulkan.
Frame buffer. Double buffering draws the next frame into a back buffer and swaps it during the vertical retrace, which avoids tearing. A depth buffer stores the nearest surface at each pixel.
| Stage group | Works on | Units |
|---|---|---|
| Geometry (1 to 6) | Vertices | 3, 4, 5, 7 |
| Pixel (7 to 9) | Fragments | 1, 2, 6 |
Conclusion. The pipeline lets complex scenes be drawn in real time because every stage is a simple, parallel operation; understanding it explains the structure of this whole subject.