Unit 6 · 30 min read
Wireframing and Prototyping
What the syllabus asks for 7
- From idea to product: the fidelity ladder
- Wireframes
- Prototyping
- UX storyboarding
- Transitions and animation in prototypes
- Creating a simple clickable prototype (the lab method)
- Seeing the ideas: sketches, wireframes, prototypes, storyboards and motion
Before building anything expensive, build something cheap and learn from it.
This unit covers wireframes and mock-ups, low- and high-fidelity prototypes, interactive and software prototyping, storyboards, transitions and animation, and the steps of creating a simple clickable prototype — the skills the 48-hour lab practises.
- Wireframes versus mock-ups versus prototypes.
- Low-fidelity and high-fidelity prototyping, with the trade-offs.
- Interactive prototypes and software prototyping tools.
- UX storyboarding.
- Transitions and animation, and how to create a simple clickable prototype.
6.1 From idea to product: the fidelity ladder
| Artefact | What it shows | Fidelity | Made in | Used to |
|---|---|---|---|---|
| Sketch | rough ideas | very low | pen and paper | explore many ideas |
| Wireframe | structure and layout, no visual style | low | paper, Balsamiq, Figma | agree on content and flow |
| Mock-up | static, full visual design | high (visual) | Figma, XD, Sketch | agree on look and feel |
| Prototype | interactive simulation | low to high | Figma, paper, code | test the experience |
| Product | working software | final | code | ship |
The rule: the earlier the stage, the cheaper the change. A line moved on a wireframe costs seconds; the same change after coding costs days.
6.2 Wireframes
A wireframe is a simple, black-and-white (grey-box) layout of a screen that shows what goes where: the structure, content blocks, navigation, hierarchy and the functional elements — without colours, real images or final typography.
Its purpose is to discuss layout and function without being distracted by aesthetics.
Conventions: boxes with a cross for images; horizontal lines or "Lorem ipsum" for text blocks (or real headings — real content is better); rectangles for buttons and inputs labelled with their action; annotations numbered and explained beside the frame; a few greys only.
| Level | Description |
|---|---|
| Low-fidelity wireframe | rough, often hand-sketched; no measurements; focuses on flow and concept |
| Mid-fidelity wireframe | digital, aligned to a grid, real labels, realistic proportions, still grey |
| High-fidelity wireframe | detailed layout with real content and exact spacing but little or no colour |
What a wireframe must specify
Page purpose and primary action; content blocks and their priority (hierarchy); navigation (global, local, breadcrumbs); form fields and buttons; states (empty, error, loading) for important screens; annotations for behaviour ("clicking opens a modal"); the flow to the next screen.
A set of wireframes connected by arrows forms a user flow or screen flow.
Wireframing process
- Review the personas, journey map, requirements and the site map.
- List the screens (screen inventory) and the task flow for each key task.
- Sketch each screen quickly (Crazy 8s).
- Choose a grid and a device (design the smallest screen first).
- Build the wireframes digitally, with real content where possible.
- Annotate and number the notes.
- Review with stakeholders and developers; test with 3–5 users using a clickable wireframe; revise.
Login screen (mobile, 360 px): top: logo centred (48 px); heading "Welcome back"; below, an email field (label above, 48 px high), a password field with a show-password toggle, a full-width primary button Log in, below it a text link Forgot password?, and at the bottom the line "New here?
Create account". Annotation 1: "Log in" disabled until both fields are valid. Annotation 2: Wrong password: inline error under the password field, no page reload. Hierarchy: heading → fields → primary button → secondary links. There is exactly one primary action.
Mock-ups
A mock-up is a static, high-fidelity visual design of a screen: real colours, typography, imagery, icons and spacing — what the product will look like — but not clickable. It applies the style guide to the wireframe.
It is used to get visual sign-off and as the source for developer hand-off (measurements, assets, styles). A style tile or mood board precedes it; a design system keeps all mock-ups consistent.
6.3 Prototyping
A prototype is an early, simplified, interactive simulation of a product that lets you try the design and learn before the real build. Why: test usability cheaply, communicate ideas, get stakeholder buy-in, find problems early, and give developers a clear target.
Low-fidelity prototyping
| Low-fidelity | High-fidelity | |
|---|---|---|
| Appearance | rough: paper, grey boxes, simple clickable wireframes | realistic: final colours, type, images, animations |
| Interaction | manual ("Wizard of Oz": a person plays the computer) or basic links | realistic clicks, transitions, form behaviour, sometimes real data |
| Speed and cost | minutes to hours; very cheap | hours to days; more expensive |
| Best for | early concept and flow testing; structure and content | late validation, visual and detailed interaction testing, stakeholder demos, developer reference |
| Feedback you get | about flow, labels, concept | about visual design, micro-interactions, finer usability |
| Risk | users may struggle to imagine; less realistic response | people comment on colours instead of function; cost of changes; team becomes attached |
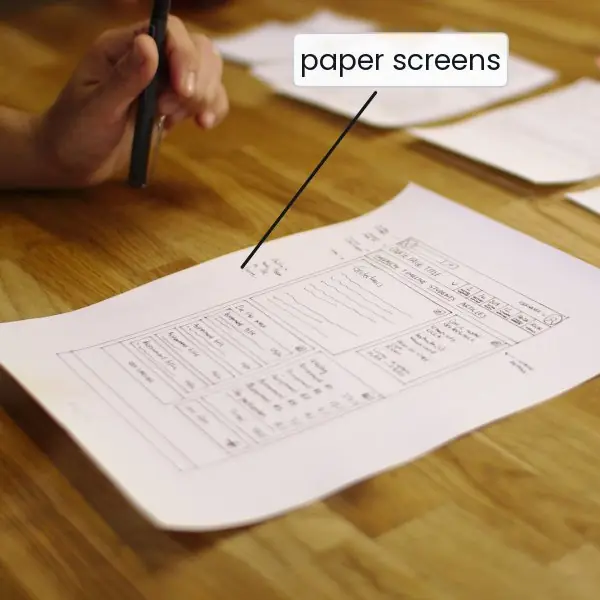
Paper prototyping: draw screens on cards; a "facilitator" swaps the cards in response to the user's finger taps while a note-taker records. Fast and effective for testing flows.
Vertical prototypes implement one feature in depth; horizontal prototypes show the whole breadth at shallow depth.
High-fidelity and interactive prototyping
An interactive prototype links screens so the user can click through the flow.
Elements: hotspots/triggers (click, tap, drag, hover, key press, after-delay), actions (navigate to a frame, open an overlay, scroll, change a component's variant, set a variable), transitions (how the next screen arrives), overlays (modals, drawers), states/variants of components (default/hover/pressed), and sometimes variables and conditional logic (e.g. show an error if the field is empty).
Software prototyping tools
| Tool | Strength |
|---|---|
| Figma | design and prototype in one file; components with variants; Smart Animate; variables and conditional logic; prototypes shareable by link; free tier |
| Adobe XD | (maintenance mode) simple linking, auto-animate, voice prototyping |
| Sketch + plugins / Principle / InVision | macOS design, with separate prototyping tools |
| Balsamiq | intentionally sketchy low-fidelity wireframes |
| Axure RP | complex logic and conditional prototypes, documentation |
| ProtoPie, Framer | advanced, code-like interactions and sensors |
| Marvel, Proto.io | quick clickable image-based prototypes |
| Code prototypes (HTML/CSS/JS, Flutter) | when the interaction needs real behaviour |
Software prototyping (in the software-engineering sense)
In software engineering, prototyping also means building a working early version to clarify requirements.
Throwaway (rapid) prototype: built quickly to explore, then discarded; evolutionary prototype: refined step by step into the final system; horizontal (interface only) and vertical (a thin full slice) prototypes.
Risk: stakeholders mistaking a prototype for the finished product or, worse, shipping it. UX prototypes are normally throwaway.
6.4 UX storyboarding
A storyboard is a sequence of drawn panels, like a comic strip, that shows a user in a context achieving a goal with the product.
It puts the human story and the environment around the screens: where the user is, what triggers the need, what happens, how the user feels at the end.
Elements: a persona (character), a scenario/setting, a trigger (problem), steps of interaction (one panel each; typically 4–8), a resolution (outcome), short captions and (optionally) emotion cues. Use simple drawings, stick figures, speech bubbles.
Persona: Sita, BCA student, bus to college. 1. Context — Sita on the bus sees a notice: exam forms close tonight. 2. Trigger — she worries about travelling back to college before the deadline. 3.
Interaction — she opens the college app, which has autosaved yesterday's partial form. 4. Interaction — she pays with eSewa in two taps. 5. Feedback — the app shows a green confirmation and the receipt; an SMS arrives. 6.
Outcome — Sita smiles and puts the phone away. Storyboards reveal needs the screens alone do not: poor connectivity on the bus ⇒ the design needs offline autosave.
Uses: communicate a concept, justify features, find missing steps and edge cases, align the team. Storyboard types: scenario storyboards (the whole story), screen storyboards (the sequence of screens, the same as a screen flow), video prototypes.
6.5 Transitions and animation in prototypes
Motion explains changes, gives feedback, directs attention and adds personality — but must serve a purpose.
| Purpose | Example |
|---|---|
| Orientation | a new screen slides in from the right, so "back" is obviously to the left |
| Feedback | a button depresses, a heart pulses after "like" |
| Status | a spinner or skeleton screen while loading |
| Focus | a shake on an invalid field; a highlight on a new item |
| Continuity | a thumbnail expands into the detail view (shared-element transition) |
| Delight / brand | a small celebratory animation on completing a task |
Transition types in prototyping tools
Instant, dissolve/fade, slide in/out (left, right, up, down), push, move in/out, and Smart Animate (Figma) / Auto-Animate (XD) — the tool interpolates between two frames in which matching layers differ in position, size, colour or opacity.
Timing and easing
- Duration: micro-interactions 100–200 ms; small transitions 200–300 ms; large transitions (full-screen) 300–500 ms; avoid > 500 ms — it feels sluggish. Mobile is a bit shorter than desktop.
- Easing (the speed curve): ease-out (fast start, slow end) for things entering; ease-in (slow start, fast end) for things leaving; ease-in-out for moving between points; linear only for continuous loops (spinners). Natural motion is never perfectly linear.
- Accessibility: some users get motion sickness or distraction — respect the system's reduce motion setting and avoid flashing (no more than three flashes per second); animation must never be the only way to convey information.
- Performance: animate
transformandopacity(cheap) rather than layout properties; aim for 60 frames per second (16.7 ms per frame).
The 12 principles of animation (Disney), adapted for UI: ease in/out (slow in, slow out), anticipation (a slight pull-back before an action), follow-through, staging, timing, secondary action.
6.6 Creating a simple clickable prototype (the lab method)
A clickable prototype of a three-screen flow (Home → Product → Checkout confirmation) in Figma, or the equivalent in XD or Sketch:
- Set up: create a file; choose the device frame (e.g. 360 × 800 for Android); set a layout grid (4 columns, 16 px margins) and 8 px spacing.
- Define styles: colour styles (primary, neutrals, semantic), text styles (H1–H3, body, caption), effect styles (shadow).
- Build components once: button (variants primary/secondary, states default/hover/disabled), text field, card, top app bar, bottom tab bar. Use auto layout so components resize with their content.
- Design the three frames from your wireframes using the components; name layers and frames clearly.
- Switch to prototype mode and draw connections: from the "Buy now" button to the Checkout frame (trigger On tap, action Navigate to, animation Smart animate or Slide in, 300 ms, ease-out); from the Back arrow to the previous frame; from the tab-bar icons to their frames.
- Add an overlay (a modal or bottom sheet) with Open overlay and a Close overlay action; add a component variant change for a pressed state and an After delay trigger for a splash screen.
- Set the starting frame and device preview; run the prototype on a phone (the tool's mobile app) or in the browser.
- Test: ask a colleague to complete a task ("Buy the blue shirt") while thinking aloud; note where they hesitate; fix and re-test.
- Share: a link with comment access; hand-off via Dev Mode or inspect panel (spacing, colours, text styles, exported assets).
The lab outcomes in the syllabus map directly to these steps: using the tool's features; page layout, fonts and responsive design; colour theory and typography; grids and layouts; interactive elements; windows and controls; navigation styles; wireframes and prototypes; storyboards; effects, styles and animation.
6.7 Seeing the ideas: sketches, wireframes, prototypes, storyboards and motion
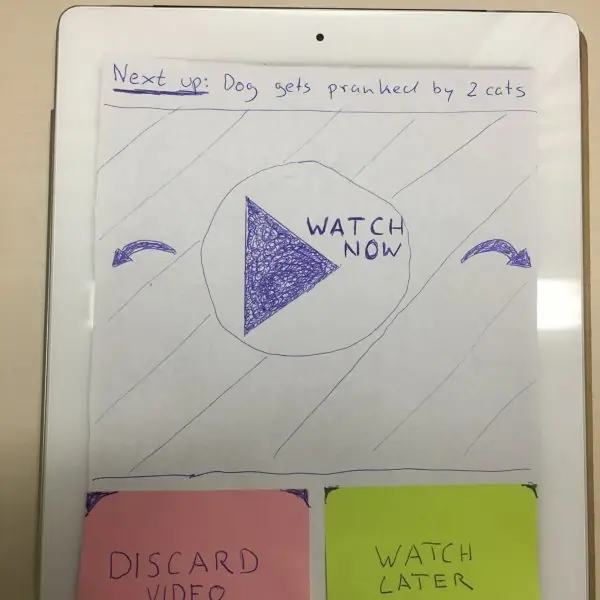
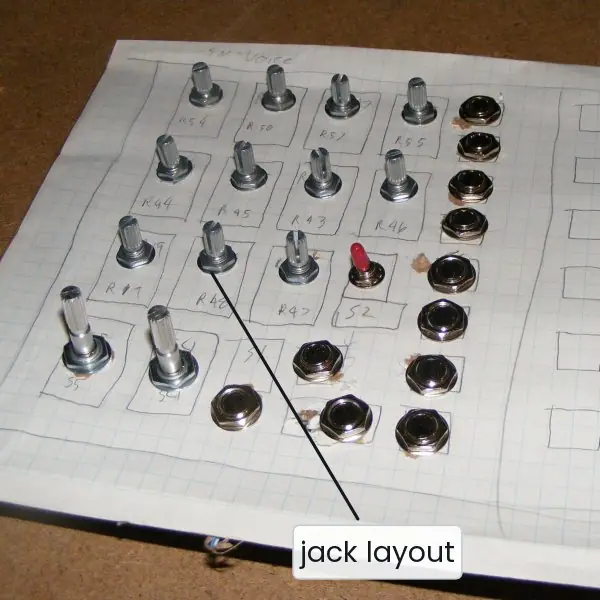
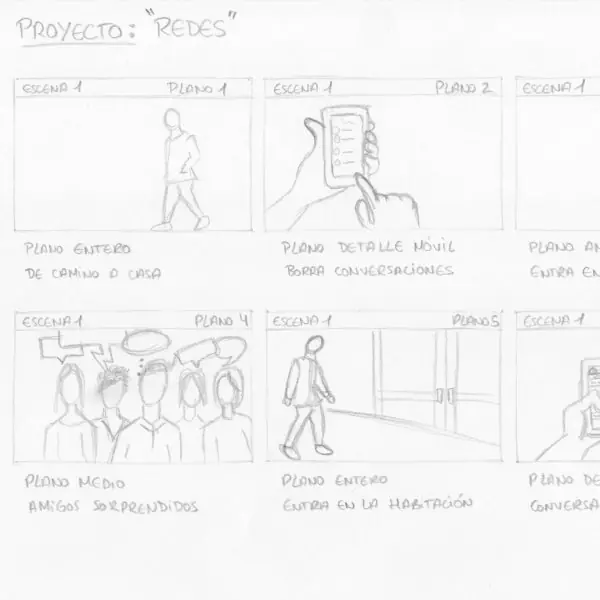
A prototype is a question asked cheaply. Plate 6.1 shows four real ones: hand-drawn screens on a desk, a paper prototype on a tablet, a cardboard mock-up of a hardware panel and a six-panel storyboard.
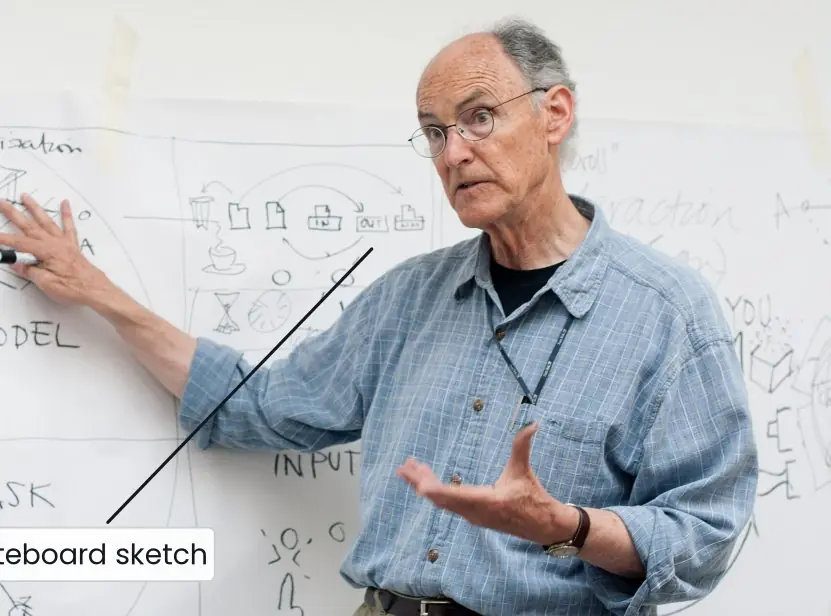
Plate 6.2 shows a design teacher at a whiteboard and the difference between a horizontal and a vertical prototype.
The figures then draw the fidelity ladder with the cost of change, annotate a real wireframe, show one screen at three fidelities, connect three frames into a clickable flow, tell a story in six panels and plot the easing curves that make motion feel natural.


6.7.1 Eight advantages of prototyping before building, with Nepali examples
- Cheap mistakes. A change on paper takes minutes, while the same change in finished code can take days (Fig. 6.1). A student team building a college fee app can redraw the payment screen ten times before a developer writes a single line. The money saved goes into features that users actually need.
- Early user feedback. A paper prototype (Plate 6.1b) lets real users tap, hesitate and speak aloud while the facilitator swaps sheets. Three to five users usually reveal the biggest problems. An eSewa-style wallet team can find in one afternoon that people look for "Send money" and not "Transfer".
- A shared picture for the team. Words such as "a simple home page" mean different things to different people. A wireframe (Fig. 6.2) fixes the structure, the priority and the primary action in a form that designers, developers and the client all read in the same way. Meetings become shorter because everybody points at the same drawing.
- Focus on function before beauty. Grey boxes stop people arguing about colours and make them argue about content and flow (Fig. 6.3). A Nagarik App style service portal first needs the right steps for a citizenship certificate request. The style comes later, in the mock-up.
- Stakeholder buy-in. A clickable prototype (Fig. 6.4) is easy for a principal or a bank manager to understand, because they can use it on a phone. A Tribhuvan University EMIS style result screen can be shown to the campus chief in a week. Agreement comes early, and late changes of mind become rarer.
- Problems found in context. A storyboard (Fig. 6.5) puts the user on a bus, in a field or in a shop, where the real problems appear. A farmer checking prices with a weak mobile signal needs offline data and a Nepali interface. These needs never show up if you draw only the screens.
- Better hand-off to developers. A finished prototype with named layers, components and styles gives developers exact sizes, colours and behaviours. It removes guesswork and rework. A ConnectIPS style form with its error states already shown is much faster to code than a form described in a long document.
- Better motion and feel. A prototype lets you test timing and easing on a real phone (Fig. 6.6) and decide whether a screen change feels quick or sluggish. A 300 ms ease-out slide feels natural, while a 700 ms fade feels slow on a cheap phone. Testing early also lets you check reduced-motion settings for users who get dizzy.
Formula and fact sheet
- Ladder: sketch → wireframe (structure, no style) → mock-up (static visual) → prototype (interactive) → product.
- Low-fi = quick, cheap, concept and flow; high-fi = realistic, visual and detail testing.
- Prototype triggers: tap, drag, hover, key, after-delay; actions: navigate, overlay, scroll, change variant.
- Storyboard: persona + context + trigger + 4–8 steps + outcome.
- Motion: 100–200 ms micro, 200–300 ms small, 300–500 ms large; ease-out entering, ease-in leaving; respect reduce-motion; 60 fps = 16.7 ms.
Chapter summary
- Wireframes show structure and priority without style; mock-ups add the visual design; prototypes make them interactive so they can be tested.
- Low-fidelity prototypes (paper, grey boxes) test concepts early and cheaply; high-fidelity ones test visuals and detailed interaction late.
- Prototyping tools such as Figma link frames with triggers, actions and transitions; software prototypes may be throwaway or evolutionary.
- Storyboards tell the user's story in context and reveal needs that screens alone hide.
- Animation should orient, give feedback and focus attention, with sensible duration and easing and respect for accessibility.
Practice
- Differentiate between a wireframe, a mock-up and a prototype.
- Compare low-fidelity and high-fidelity prototyping with advantages and risks.
- Draw a low-fidelity wireframe of a mobile "attendance" app's home screen and annotate three elements.
- What are the elements of a good wireframe? Describe the wireframing process.
- Explain paper prototyping and the "Wizard of Oz" technique.
- Create a six-panel storyboard for a farmer checking market prices on a phone.
- List five purposes of animation in a prototype with an example each.
- What duration and easing would you use foraa button press,ba screen transition,ca closing dialog? Why?
- List the steps for building a simple clickable prototype in Figma.
- Explain throwaway and evolutionary prototypes and one risk of prototyping.
Answers and worked solutions
1. Wireframe: structure/layout without visual style; mock-up: static high-fidelity visual design; prototype: interactive simulation that can be clicked and tested.
2. Low-fi: fast, cheap, encourages structural feedback, but less realistic; high-fi: realistic, good for visual/interaction testing and demos, but costly, slow to change and invites comments on colours.
3. A header "Attendance" with the date, a list of classes (cards) each with a status chip and a "Mark" button, a bottom tab bar (Home, History, Profile). Annotations: card tap → class detail; Mark → marks present and shows a snackbar; empty state → "No classes today".
4. Elements: purpose and primary action, content blocks and hierarchy, navigation, forms and buttons, states, annotations, flow. Process: review research, list screens, sketch, choose grid, build, annotate, review, test, revise.
5. Paper screens are swapped by a facilitator in response to taps. In "Wizard of Oz" a person secretly plays the system (e.g. voice or smart responses) to test a concept without building it.
6. Panels: farmer at the field; wonders about today's price; opens the app (Nepali interface); selects the crop; sees today's market prices and trend; decides where to sell and smiles.
7. Orientation (slide-in), feedback (button press), status (spinner), focus (shake on error), continuity (shared-element expand), delight (celebration).
8.(a) 100–150 ms, ease-out (instant feedback);(b) 250–300 ms, ease-in-out or ease-out (clear but quick);(c) ~200 ms, ease-in (leaving elements accelerate away).
9. Set up frame and grid → styles → components → design frames → prototype mode and connections → overlays/variants/delay → set start and preview → test → share and hand off.
10. Throwaway: built to learn and then discarded; evolutionary: refined into the final product. Risk: a prototype mistaken for a finished product, or the team becoming attached to it and skipping redesign.
Model answers for Unit 6
Q1. Differentiate between a wireframe, a mock-up and a prototype, and describe the process of creating wireframes. (10 marks)
Introduction. Design moves from rough ideas to a working product in stages, and each stage has its own artefact.
A sketch explores ideas, a wireframe fixes structure, a mock-up fixes appearance and a prototype fixes behaviour (Fig. 6.1). The rule behind this order is that the earlier the stage, the cheaper the change.
Comparison.
| Point | Wireframe | Mock-up | Prototype |
|---|---|---|---|
| What it shows | structure, content blocks, priority, flow | final colours, type, images, spacing | how screens connect and respond |
| Look | grey boxes, no style (Fig. 6.2) | fully styled, high fidelity (Fig. 6.3c) | low to high fidelity |
| Interaction | none, or simple links | none, it is static | clicks, transitions, overlays (Fig. 6.4) |
| Main question | is the layout right? | does it look right? | does it work for people? |
| Tools | paper, Balsamiq, Figma | Figma, XD, Sketch | Figma, paper, code |
| Typical use | agree content and flow | visual sign-off and hand-off | usability testing |
What a wireframe must specify. A good wireframe states the purpose of the page and its one primary action; the content blocks in priority order; the navigation (global, local, breadcrumbs); every form field and button; the important states (empty, error, loading); numbered annotations for behaviour; and the link to the next screen.
Several wireframes joined by arrows form a screen flow.
Process of wireframing.
- Review the personas, journey map, requirements and site map.
- List the screens (screen inventory) and the task flow of each key task.
- Sketch each screen quickly, for example with Crazy 8s.
- Choose a grid and a device, and design the smallest screen first.
- Build the wireframes digitally with real content where possible.
- Annotate and number the notes (Fig. 6.2, notes 1 to 5).
- Review with stakeholders and developers, test a clickable version with three to five users and revise.
Fidelity levels. Low-fidelity wireframes are hand-sketched and show flow only; mid-fidelity ones are digital, on a grid, with real labels; high-fidelity wireframes use real content and exact spacing but almost no colour.
Worked example. The login screen of a college app is drawn at 360 px width: a logo, the heading "Welcome back", an email field, a password field with a show toggle, one full-width Log in button, a "Forgot password?" link and "Create account" at the bottom.
Note 4 says the button stays disabled until both fields are valid, and note 5 says that a wrong password shows an inline error without reloading the page.
Conclusion. The wireframe settles structure, the mock-up settles style and the prototype settles behaviour. Doing them in this order means expensive visual work is never wasted on a flawed layout.
Q2. Compare low-fidelity and high-fidelity prototyping with advantages and risks. (5 marks)
A prototype is an early, simplified, interactive simulation of a product, built to learn before the real build. Its fidelity is how close it is to the final product in look and behaviour (Fig. 6.3).
| Point | Low fidelity | High fidelity |
|---|---|---|
| Appearance | paper, grey boxes, simple clickable wireframes | final colours, type, images and animation |
| Interaction | manual, a person plays the computer, or basic links | realistic taps, transitions, form behaviour |
| Time and cost | minutes to hours, very cheap | hours to days, more costly |
| Best for | early concept, structure and flow | late visual and detailed interaction checks, demos |
| Feedback | about flow, labels and ideas | about visuals, timing and fine usability |
| Risk | users find it hard to imagine the real product | people comment on colours, and the team gets attached |
Advantages. Low-fidelity prototypes invite honest criticism because they look unfinished, and they can be thrown away without regret.
High-fidelity prototypes feel real, so test users behave naturally, and they give developers a clear target.
Risks. A rough prototype may be misunderstood, while a polished one costs time, hides structural problems under good looks and may be mistaken for the finished product.
Practical rule. Start low, test, then move up; a Nepali college fee app might use a paper prototype in week one and a clickable Figma prototype in week three.
Q3. Explain paper prototyping and the Wizard of Oz technique. (5 marks)
Paper prototyping means drawing each screen of an interface on paper or cards and testing it with users before any software exists (Plate 6.1b).
A facilitator acts as the computer: when the user taps a paper button, the facilitator swaps in the next sheet, adds a sticky note for a pop-up or writes a typed entry on a card.
A note-taker records where the user hesitates, and often a second person watches.
How a session runs.
- Prepare the sheets for one task, such as paying the exam fee, and the likely wrong paths.
- Give the user a realistic task, not instructions for the buttons.
- Ask the user to think aloud while tapping with a finger or a pencil.
- Swap the sheets without helping; silence tells you where the design fails.
- Redraw the weak screens immediately and test again with the next user.
Advantages. It needs only paper and pens, can be changed in minutes, lets non-designers join in and focuses the talk on structure and wording. Limits. It cannot test speed, animation or real data well.
Wizard of Oz. In this technique a person secretly plays the intelligent part of the system. For a voice assistant or a smart chatbot, a hidden team member types or speaks the replies while the user believes the machine is answering.
The team learns what people would really ask and which replies work before spending money on speech recognition or machine learning.
Q4. Explain the steps of creating a simple clickable prototype in a tool such as Figma, and the elements that make it interactive. (10 marks)
Introduction. A clickable prototype links finished or rough frames so that a user can tap through a flow, such as Home to Product to Checkout, and feel it before it is built (Fig. 6.4).
Tools such as Figma, Adobe XD and Sketch with plug-ins support this, and Figma is the most common free choice.
Elements that make a prototype interactive.
| Element | Meaning | Example |
|---|---|---|
| Hotspot or trigger | the event that starts a response | tap, drag, hover, key press, after delay |
| Action | what happens | navigate to a frame, open an overlay, scroll, change a variant |
| Transition | how the next screen arrives | instant, dissolve, slide, push, Smart animate |
| Overlay | a layer above the frame | modal, bottom sheet, drawer |
| Variant or state | a component in another state | button default, hover, pressed, disabled |
| Variable and logic | stored values and conditions | show an error if the field is empty |
Steps.
- Set up a file, choose a device frame such as 360 by 800 px, add a layout grid and an 8 px spacing rule.
- Define styles for colour (primary, neutrals, semantic), text (H1 to H3, body, caption) and shadows.
- Build components once (button, text field, card, app bar, tab bar) and use auto layout so they resize with their content.
- Design the frames from the wireframes using the components, and name the layers clearly.
- Switch to prototype mode and draw connections: Buy now to Checkout (On tap, Navigate to, Smart animate, 300 ms, ease-out), Back to the previous frame, tab-bar icons to their frames.
- Add an overlay such as a size picker with Open overlay and Close overlay, a pressed-state variant and an After delay trigger for a splash screen.
- Set the start frame and run the prototype on a phone or in the browser.
- Test with a colleague who thinks aloud while buying the blue shirt; note where they hesitate, fix and test again.
- Share a link with comment access and hand off through the inspect panel (spacing, colours, text styles and exported assets).
Good practice. Prototype one key task and not the whole app; mark the start frame; keep names clear; and remember that a prototype is a throwaway for learning, not production code.
Conclusion. A clickable prototype turns static pictures into an experience that can be tested. Because it is built from reusable components and clear connections, it can be changed in minutes and handed to developers with exact measurements.
Q5. What is a UX storyboard? Draw and explain a six-panel storyboard for a student paying an exam fee. (5 marks)
A storyboard is a sequence of drawn panels, like a comic strip, that shows a person in a real setting using the product to reach a goal (Plate 6.1d, Fig. 6.5). It adds the human story and the surroundings that screens alone cannot show.
A storyboard contains a persona, a setting, a trigger (the problem), four to eight steps of interaction, a resolution and short captions.
Six panels for Sita.
- Context: Sita sits on the college bus and sees a notice that exam forms close tonight.
- Trigger: she worries that she cannot reach the college computer before the deadline.
- Interaction: she opens the college app, which saved her partly filled form yesterday.
- Interaction: she pays with a wallet in two taps.
- Feedback: a green confirmation, a receipt and an SMS arrive.
- Outcome: she is relieved and puts the phone away.
What the story reveals. The bus and the weak signal show that the design needs offline autosave and a short, cheap form, which would never appear if only the payment screen were drawn.
Uses. Storyboards communicate a concept, justify features, expose missing steps and edge cases, and align the team. There are scenario storyboards (the whole story), screen storyboards (the sequence of screens) and video prototypes.
Q6. Explain the purposes of animation in prototypes, and choose duration and easing for common interface actions. (5 marks)
Motion should explain a change, give feedback, direct attention or add character, and never exist only for decoration.
| Purpose | Example |
|---|---|
| Orientation | a new screen slides in from the right, so Back is clearly to the left |
| Feedback | a button depresses, a heart pulses after a like |
| Status | a spinner or skeleton screen while content loads |
| Focus | a field shakes when invalid, a new item is highlighted |
| Continuity | a thumbnail expands into the detail page (shared-element transition) |
| Delight | a small celebration after the task is finished |
Duration and easing (Fig. 6.6). Micro-interactions last 100 to 200 ms; small transitions 200 to 300 ms; full-screen transitions 300 to 500 ms; anything above 500 ms feels slow.
Use ease-out for items that enter, ease-in for items that leave, ease-in-out for a move between two points and linear only for loops such as spinners. At 60 frames per second one frame lasts 16.7 ms, so 300 ms is 18 frames.
Choices. (a) A button press: 100 to 150 ms, ease-out, because feedback must feel instant. (b) A screen change: 250 to 300 ms, ease-in-out or ease-out, clear but quick. (c) A closing dialog: about 200 ms, ease-in, because leaving items accelerate away.
Accessibility and performance. Respect the reduce-motion setting, avoid flashing more than three times per second, never carry information by animation alone, and animate only transform and opacity to keep 60 frames per second on cheap phones.