Unit 5 · 6 teaching hours · 33 min read
UI Design Considerations
What the syllabus asks for 7
- Page layout
- Colour
- Font selection and typography
- Screen size and responsive design
- Visual hierarchy
- Navigation
- Seeing the ideas: grids, Gestalt, colour, type, hierarchy and navigation
Components are the words; layout, colour, type and navigation are the grammar. This unit covers page layout, colour schemes and font selection, typography, responsive design, interactive elements, the principles of visual hierarchy, and navigation types and models.
- Page layout, grids and the Gestalt principles.
- Colour theory: colour schemes, meaning, contrast and accessibility (with computed WCAG ratios).
- Font selection and typography; type scales.
- Screen size and responsive design.
- Visual hierarchy: alignment, colour, contrast, proximity, size, texture, time.
- Navigation types and navigational models.
5.1 Page layout
Layout is the arrangement of elements on a page so the user sees what matters first and understands how things relate.
Grids
A grid divides the page into columns, gutters and margins so elements align. A common web grid is 12 columns (divisible by 2, 3, 4, 6).
Arithmetic: with a 1200 px container and 24 px gutters, column width = (1200 − 11 × 24)/12 = 78 px; a 960 px container with 20 px gutters gives (960 − 220)/12 = 61.67 px per column.
Other grids: modular grids (rows and columns for cards), baseline grids (vertical rhythm of text), hierarchical layouts.
Many teams use an 8-point spacing system (margins and padding in multiples of 8: 8, 16, 24, 32…) for consistency; touch targets of 48 px fit this system.
Reading patterns
Eye-tracking research shows people scan: the F-pattern (text-heavy pages: across the top, down the left), the Z-pattern (simple pages: top-left → top-right → diagonal → bottom-right), and the layer-cake pattern (scan headings).
So place the logo top-left, the primary call-to-action where the eye ends, and put key information above the fold (visible without scrolling), while accepting that users scroll.
Gestalt principles of perception
| Principle | Meaning | Use |
|---|---|---|
| Proximity | near things are seen as a group | space groups apart; label near its field |
| Similarity | similar things belong together | same style = same function |
| Closure | the mind completes shapes | simple logos and icons |
| Continuity | the eye follows lines and curves | aligned items, flows |
| Figure–ground | we separate subject from background | modal over a dimmed background |
| Common region | items inside a boundary are grouped | cards, panels |
| Focal point | the odd one out grabs attention | the primary button |
White (negative) space is an active element: it separates groups, rests the eye and raises perceived quality. Cramming everything in makes everything equal and therefore nothing important.
Use balance (symmetric or asymmetric), rhythm/repetition, unity and emphasis; the rule of thirds and the golden ratio (1 : 1.618 — e.g. a 960 px layout splits into about 593 px and 367 px) are sometimes used as proportion guides.
5.2 Colour
Colour models and terms
- RGB (additive; screens): red, green, blue 0–255 each; hex
#0F766E= R 15, G 118, B 110. - CMYK (subtractive; print). HSL/HSB: hue (position on the wheel, 0–360°), saturation (intensity), lightness/brightness — convenient for designers.
- Tints (add white), shades (add black), tones (add grey).
Colour schemes (harmonies)
| Scheme | How chosen | Effect |
|---|---|---|
| Monochromatic | one hue, different lightness/saturation | calm, cohesive, safe |
| Analogous | neighbouring hues (e.g. blue, teal, green) | harmonious, low contrast |
| Complementary | opposite hues (hue + 180°: a teal at 174° pairs with a red at 354°) | strong contrast, vibrant; use one as an accent |
| Split-complementary | one hue + the two neighbours of its complement | contrast with less tension |
| Triadic / tetradic | three or four hues evenly spaced | colourful, needs balance |
A reliable recipe is the 60-30-10 rule: 60 % neutral (backgrounds), 30 % secondary (surfaces, secondary UI), 10 % accent (primary buttons, links, highlights).
A UI palette normally has: primary (brand), secondary, neutrals (greys for text and borders), and semantic colours — success (green), warning (amber), error (red), info (blue) — each with light/dark variants.
Meaning of colour (and cultural variation)
Red: danger, urgency (also luck and marriage in Nepal and India); green: success, nature; blue: trust, calm; yellow/amber: caution, optimism; white: purity (but mourning in Nepali culture); black: elegance.
Meanings are cultural — test with local users. Never use colour as the only signal: about 8 % of men and 0.5 % of women have colour-vision deficiency, so add icons, text or patterns to red/green status.
Contrast and accessibility (WCAG)
WCAG defines contrast ratio = \dfrac{L₁ + 0.05}{L₂ + 0.05}, where L₁ is the relative luminance of the lighter colour and L₂ of the darker one (0 = black, 1 = white). The ratio runs from 1:1 to 21:1.
| Level | Normal text | Large text (≥ 24 px, or ≥ 18.66 px bold) | UI components and graphics |
|---|---|---|---|
| AA | ≥ 4.5 : 1 | ≥ 3 : 1 | ≥ 3 : 1 |
| AAA | ≥ 7 : 1 | ≥ 4.5 : 1 | — |
| Text colour on white background | Ratio | Verdict |
|---|---|---|
Black #000000 |
21.0 : 1 | passes AAA |
Dark grey #595959 |
7.0 : 1 | passes AAA |
Teal #0F766E |
5.47 : 1 | passes AA |
Google blue #1A73E8 |
4.51 : 1 | passes AA, just |
Mid grey #767676 |
4.54 : 1 | passes AA, just |
Grey #777777 |
4.48 : 1 | fails AA for body text (by 0.02!) |
Red #FF0000 |
4.0 : 1 | fails for small text; passes for large text |
Light grey #CCCCCC |
1.61 : 1 | fails badly (decorative only) |
Yellow #FFD700 |
1.4 : 1 | unreadable on white — but 14.97 : 1 on black |
Conclusion: pale placeholder and "disabled-looking" grey text are the most common failures; check every text/background pair with a contrast checker (Figma plugins, browser DevTools).
Also: provide a dark mode (not pure black #000 on pure white #FFF — slightly softened colours reduce glare), keep sufficient contrast for focus outlines, avoid text on busy photographs without a scrim, and never rely on hover colour changes alone.
5.3 Font selection and typography
Typography is the art of arranging type to make text readable, legible and expressive.
Type classification
| Family | Character | Use |
|---|---|---|
| Serif (Georgia, Times, Source Serif) | small strokes (serifs); traditional, formal | long-form reading, print |
| Sans-serif (Inter, Roboto, Poppins, Arial) | clean, modern | UI text and headings on screens |
| Monospace (JetBrains Mono, Consolas) | equal widths | code, tables of numbers |
| Display / script | decorative | logos and short headlines only |
| Devanagari (Noto Sans Devanagari, Mukta, Hind) | for Nepali/Hindi | check conjuncts and matras render correctly; line-height needs to be larger (≥ 1.5) because of the shirorekha and vowel signs |
Selection rules
- Limit to 1–2 families (one for headings, one for body, or one family in several weights).
- Legibility first: clear letterforms (distinct I, l, 1), large x-height, open counters; test on real devices.
- Match the brand mood (friendly, formal, technical).
- Use system fonts or a few web font files (performance) and load with
font-display: swap. - Check language coverage (Devanagari, Latin extended) and licensing.
Typographic controls
| Property | Guideline |
|---|---|
| Size | body text 16 px minimum on the web (≥ 14 sp on mobile); never fix size in px only — let users scale |
| Line height (leading) | 1.4–1.6 × font size for body text; tighter (1.1–1.3) for headings; larger for Devanagari |
| Line length (measure) | 45–75 characters per line; shorter on mobile (35–50) |
| Alignment | left-align text (for LTR scripts); avoid justified text on the web (rivers of white); never centre long paragraphs |
| Letter spacing (tracking) | default for body; slight increase for ALL-CAPS and small text |
| Weight | regular (400) for body, semi-bold/bold (600–700) for emphasis and headings; avoid very light weights for small text |
| Case | sentence case is easiest to read; avoid ALL CAPS for more than a few words |
| Emphasis | use bold or colour sparingly; avoid underline for non-links and italics for long text |
| Hierarchy | distinguish H1/H2/H3/body/caption by size, weight and spacing consistently |
Type scale
A modular scale multiplies the base size by a constant ratio: with a base of 16 px and a ratio of 1.25 (major third) the steps are 16, 20, 25, 31.25, 39.06 px (body, H4, H3, H2, H1); ratio 1.2 gives 16, 19.2, 23, 27.6, 33.2; ratio 1.333 gives 16, 21.3, 28.4, 37.9, 50.5.
Use relative units (rem): 1.25 rem = 20 px when 1 rem = 16 px; 24 px = 1.5 rem. Define 5–7 text styles (display, h1–h3, body, small, caption) and reuse them — a type system instead of ad-hoc sizes.
5.4 Screen size and responsive design
Users view the same product on phones (360–430 px wide), tablets (768–1024), laptops (1280–1536) and large monitors. Responsive web design (RWD) (Ethan Marcotte) adapts one design to any screen using three techniques:
- Fluid grids — widths in percentages/fr units rather than fixed pixels.
- Flexible media — images and video scale with their container (
max-width: 100%). - Media queries — apply different styles at breakpoints.
Typical breakpoints (examples; choose by content, not by device): ≈ 600 px (phone → tablet), ≈ 900 px, ≈ 1200 px (desktop).
Patterns: mobile-first (design and code the small screen first, then enhance — forces prioritising content); layouts that reflow (columns stack: 3 → 2 → 1), navigation that collapses (menu bar → hamburger or bottom tabs), images that crop differently, tables that scroll or become cards, hide/reveal secondary content.
Related ideas: adaptive design (a few fixed layouts), responsive typography (clamp()), viewport meta tag (width=device-width, initial-scale=1), pixel density (provide 2× images), touch vs pointer (hover alternatives), orientation changes, safe areas (notches), foldables.
Test on real devices and on throttled networks.
Interactive elements
Everything clickable must look clickable (signifier), have clear states — default, hover, focus (visible outline for keyboard users — never remove it without replacement), active/pressed, disabled, loading, error, selected — and respond within ~100 ms.
Keep touch targets ≥ 44 px with spacing; provide hover alternatives on touch screens; consistent motion (150–300 ms easing for micro-interactions; respect "prefers-reduced-motion"); feedback after submission (success message, toast); never rely on gesture alone (provide a visible alternative).
5.5 Visual hierarchy
Visual hierarchy orders elements by importance so the eye is guided: the most important thing is noticed first, the least last. Principles:
| Principle | How it creates hierarchy | Example |
|---|---|---|
| Alignment | aligned elements look related and tidy; misaligned ones look careless; a strong left edge organises content | left-aligned headings and body copy on one vertical line |
| Colour | saturated, warm, or contrasting colours draw attention; muted ones recede | one bright accent for the primary button, greys elsewhere |
| Contrast | difference in tone, size, weight or colour makes an element stand out; low-contrast = unimportant | a dark headline on a light background; the primary button filled, others outlined |
| Proximity | closeness groups elements; distance separates groups | label close to its field; more space between sections than within |
| Size | larger = more important (scale) | H1 bigger than H3; a hero image |
| Texture | patterns, shadows, borders, gradients add depth and distinguish surfaces; heavy texture attracts the eye | a card with a shadow lifts above a flat background |
| Time (and motion) | what appears or animates first is noticed first; sequencing reveals content over time | animated onboarding, a progress reveal, notifications appearing |
Other tools: position (top-left first), whitespace (isolation emphasises), repetition (consistent patterns), depth/elevation (shadows signal layers), imagery.
Test the hierarchy with the squint test: blur the design (or squint) — the elements that remain visible are the ones with the highest hierarchy; are they the right ones?
Aim for three or four levels: primary action, headings/key content, supporting content, tertiary (captions, legal).
5.6 Navigation
Navigation helps users know where they are, where they can go and how to get back. Good navigation answers three questions at any moment: Where am I? Where can I go? How do I get back? Principles: consistent placement, clear labels in users' words, current location highlighted, shallow depth (3-click myth: the length matters less than whether each click is clearly the right one), searchable, mobile-friendly.
Navigation types
| Type | Description | Examples |
|---|---|---|
| Global navigation | the main set of links present on every page — top-level sections | header menu bar, bottom tab bar in an app |
| Local (sub) navigation | links within the current section | side menu of a documentation chapter |
| Utility navigation | tools and secondary links not part of the content hierarchy: login, cart, language, help, search, account | the small links at the top-right of a page |
| Associative (related) navigation | links to related content "see also", "recommended for you", product suggestions | related articles, "customers also viewed" |
| Inline (contextual) navigation | links within body text or content | hyperlinks inside an article; in-sentence "learn more" |
| Supplementary | breadcrumbs (Home > Courses > BCA), sitemaps, footer links, pagination, tag clouds |
Navigational models (information structures)
| Model | Structure | Best for | Weakness |
|---|---|---|---|
| Hub and spoke | a central hub (home) links to separate spokes; users return to the hub to go elsewhere | mobile apps, simple tasks, dashboards (e.g. phone home screen) | no direct movement between spokes; extra steps |
| Fully connected | every page links to every other | very small sites (≤ 5–7 pages) | collapses as the site grows (n(n − 1) links) |
| Multilevel / tree (hierarchical) | home → categories → subcategories → items | large content sites, e-commerce, documentation | deep trees hide content; users get lost; requires good labels and breadcrumbs |
| Stepwise (sequential) | a fixed order: step 1 → 2 → 3 (wizards, checkout, onboarding, forms) | processes with a required sequence | rigid; need progress indicator, back and save |
| Pyramid | a sequence where users move forward and back, with branches to detail pages at levels (a hierarchy of steps, e.g. an online course: lesson 1 → lesson 2 with side references) | tutorials, linear stories, documents with details | users can skip, less flexible than a tree |
| Flat | all pages at one level, reached directly from one menu | small sites, single-page sites, portfolio | does not scale beyond ~10 items |
Mobile patterns: bottom tab bar (3–5 destinations), navigation drawer (hamburger), gesture navigation (swipe back), search-first, floating action button.
A navigation test: tree testing (users find items in a text-only sitemap) and card sorting (users group content), both measure whether the structure matches users' mental models.
5.7 Seeing the ideas: grids, Gestalt, colour, type, hierarchy and navigation
Visual design is old craft applied to new screens.
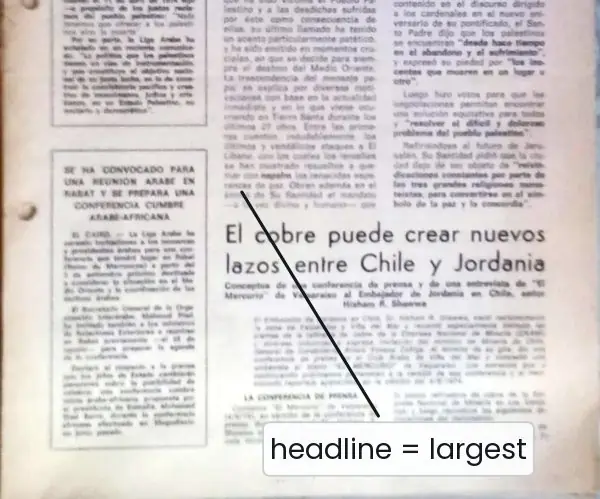
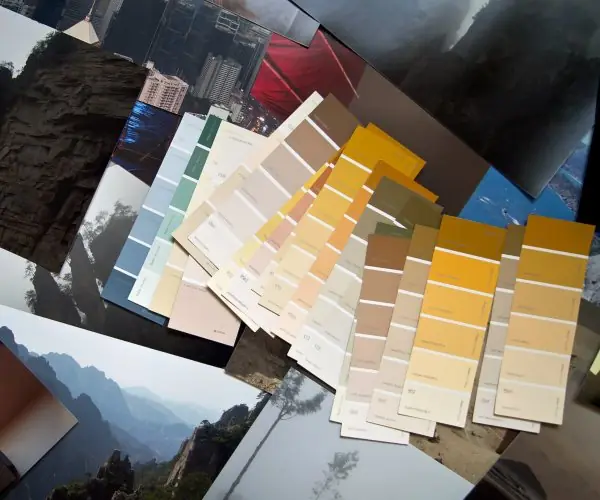
Plate 5.1 shows three printed ancestors of every layout rule: a newspaper front page with its column grid and headline hierarchy, the Gutenberg Bible with its two-column text block, and paint-colour swatches that are laid out like a palette.
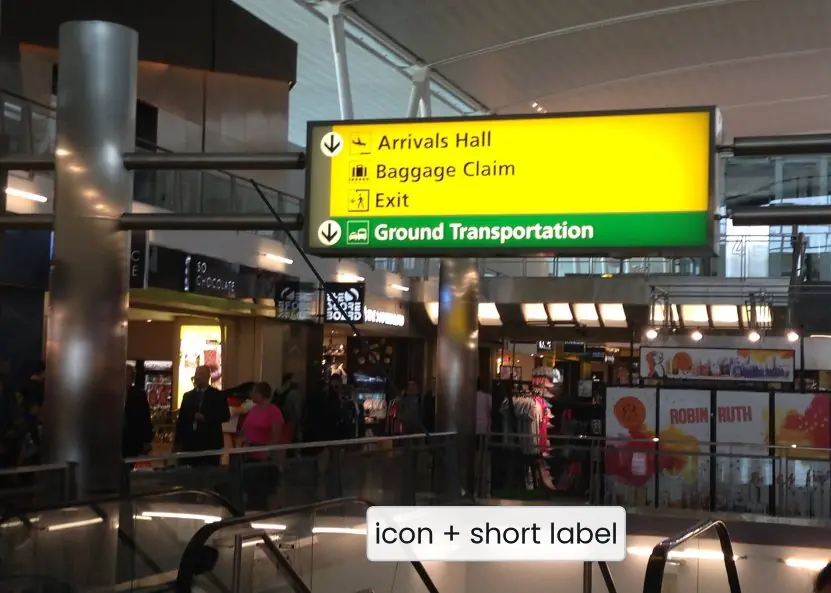
Plate 5.2 shows real navigation: the signs of two airports.
The figures then compute a 12-column grid, draw the Gestalt principles, derive colour schemes from the colour wheel, build a type scale, compare a flat and a ranked screen, and draw the six navigation structures.




5.7.1 Eight rules for visual design and navigation in Nepal
- Build on a grid. Align every box to a 12-column grid (Fig. 5.1) so that spacing is regular and the page looks calm. A college portal with a header, a 3-column sidebar and a 9-column main area is easy to build and to make responsive. Developers also like it, because the numbers are exact.
- Group by proximity and common region. Put a label next to its field and more space between sections than inside them (Fig. 5.2). On a Fonepay or eSewa payment screen, the amount, the payee and the Pay button should look like one group. Clear groups let the user read the screen without effort.
- Choose a small palette. Pick one brand colour and neutral greys, and use the 60-30-10 rule (Fig. 5.3). Keep the accent for the primary button so it stands out. Check that the colours still look right under Nepali sunlight on a cheap phone.
- Never use colour alone. About 8 percent of men have colour-vision deficiency (Plate 3.2b), and red can mean danger or good luck in Nepal. Add an icon, a text word or a pattern to every status colour. White is purity in some countries but mourning in Nepali culture, so test with local users.
- Set readable type. Use 16 px or more, a line height of 1.4 to 1.6 and 45 to 75 characters per line (Fig. 5.4). Devanagari needs 1.5 or more because of the shirorekha and the vowel signs, and the font must show conjuncts correctly. Use one or two families and a modular scale.
- Rank the screen. Decide what is first, second and third, and use size, colour, contrast and space to show it (Fig. 5.5). A newspaper does this with its headline (Plate 5.1a). Try the squint test: if the wrong thing remains visible, change the design.
- Keep navigation predictable. Put global navigation in the same place on every page, highlight the current place, add breadcrumbs for deep sites and use words that users use (Plate 5.2). A government service site should let a citizen find "Passport" in two clicks, not search through six menus. Test the structure with card sorting and tree testing.
- Choose the structure to fit the task. Use hub and spoke for a simple app, a stepwise flow for a payment or a form, a tree for a large catalogue and a flat menu for a small site (Fig. 5.6). A fully connected site breaks when it grows, because links grow as n(n - 1) / 2. Add a progress indicator to any stepwise flow.
Formula and fact sheet
- Contrast ratio = \dfrac{L₁ + 0.05}{L₂ + 0.05}; AA: 4.5 : 1 text, 3 : 1 large text and UI; AAA: 7 : 1 / 4.5 : 1.
- Grid: column = (container − 11 × gutter)/12. 8-point spacing system.
- Typography: body ≥ 16 px; line-height 1.4–1.6; line length 45–75 characters; type scale = base × ratioⁿ (1.25: 16, 20, 25, 31.25, 39.06).
- Responsive: fluid grids + flexible media + media queries; mobile-first; breakpoints ≈ 600 / 900 / 1200 px.
- Visual hierarchy tools: alignment, colour, contrast, proximity, size, texture, time.
- Navigation types: global, local, utility, associative, inline. Models: hub-and-spoke, fully connected, multilevel/tree, stepwise, pyramid, flat.
- 60-30-10 colour rule; complementary = hue + 180°.
Chapter summary
- Layout uses grids, reading patterns, Gestalt principles and white space to make structure visible.
- Colour schemes are built from a primary, secondary, neutral and semantic palette; contrast must meet WCAG ratios and colour must never be the sole signal.
- Typography chooses one or two legible families, readable sizes, line height, line length and a consistent type scale; Devanagari needs extra leading.
- Responsive design combines fluid grids, flexible media and media queries, designed mobile-first.
- Visual hierarchy ranks elements through alignment, colour, contrast, proximity, size, texture and time.
- Navigation comes in global, local, utility, associative and inline forms and follows a model — hub-and-spoke, fully connected, tree, stepwise, pyramid or flat — chosen to fit the content.
Practice
- Explain the F-pattern and Z-pattern and the design consequences.
- Calculate the column width for a 12-column grid, 1140 px container and 30 px gutters.
- Explain any four colour schemes and the 60-30-10 rule.
- State the WCAG AA contrast requirements. Is
#777777text on white acceptable for body text? Why? - Give six rules for choosing and setting typography for a Nepali–English website.
- Generate a type scale with ratio 1.25 from a 16 px base for five steps.
- Explain responsive web design and mobile-first design.
- Explain the seven principles of visual hierarchy.
- Compare global, local, utility, associative and inline navigation with examples.
- Which navigational model suitsaa phone settings app,ban e-commerce site with 5,000 products,ca checkout flow,da five-page personal portfolio? Explain.
Answers and worked solutions
1. F-pattern: on text-heavy pages, users read across the top, then down the left, scanning less to the right → put key information and headings at the top and left. Z-pattern: on simple pages the eye goes top-left → top-right → diagonally to bottom-left → bottom-right → logo top-left, call to action bottom-right.
2. (1140 − 11 × 30)/12 = (1140 − 330)/12 = 810/12 = 67.5 px.
3. Monochromatic (one hue), analogous (neighbours), complementary (opposites), triadic (three evenly spaced hues). 60-30-10: 60 % dominant neutral, 30 % secondary colour, 10 % accent.
4. AA: ≥ 4.5 : 1 for normal text, ≥ 3 : 1 for large text and UI components. #777777 on white = 4.48 : 1, so it fails AA for body text (use #767676 or darker).
5. Limit to 1–2 families; choose fonts that cover Devanagari and Latin (e.g. Noto Sans Devanagari with Inter); body ≥ 16 px; line height ≥ 1.5 for Devanagari; line length 45–75 characters; left-align; use sentence case and avoid ALL CAPS; use a type scale; test conjuncts.
6. 16, 20, 25, 31.25, 39.06 px.
7. RWD adapts one design to any screen using fluid grids, flexible media and media queries; mobile-first designs the smallest screen first and enhances it for larger ones, forcing priorities.
8. Alignment, colour, contrast, proximity, size, texture and time (details in 5.5).
9. Global: the main menu on every page; local: a section's side menu; utility: login, cart, language; associative: "related articles"; inline: links inside text.
10.(a) Hub and spoke — a central list of independent settings;(b) multilevel/tree with search and breadcrumbs;(c) stepwise with progress indicator;(d) flat (or fully connected) — only five pages.
Model answers for Unit 5
Q1. Explain page layout: grids, reading patterns and the Gestalt principles. (10 marks)
Introduction. Layout is the arrangement of elements on a page so that the user sees what matters first and understands how the parts relate. Good layout rests on a grid, on how the eye moves and on how the mind groups things.
Grids. A grid divides the page into columns, gutters and margins so that elements align (Fig. 5.1). A common web grid has 12 columns, because 12 divides by 2, 3, 4 and 6.
With a 960 px container and 20 px gutters, a column is (960 - 11 x 20) / 12 = 61.67 px. Other grids are the modular grid (cards), the baseline grid (text lines) and the hierarchical grid.
Reading patterns. Eye tracking (Plate 3.2c) shows that people scan: the F-pattern for text-heavy pages, the Z-pattern for simple pages and the layer-cake pattern when headings are scanned.
Therefore the logo goes top-left, the main call to action where the eye ends, and key information above the fold.
Gestalt principles (Fig. 5.2).
| Principle | Meaning | Use |
|---|---|---|
| Proximity | near things form a group | label near its field |
| Similarity | similar things belong together | same style, same job |
| Closure | the mind completes shapes | simple logos and icons |
| Continuity | the eye follows lines | aligned items and flows |
| Figure and ground | subject separates from background | modal over a dimmed page |
| Common region | a boundary groups its contents | cards and panels |
| Focal point | the odd one out wins attention | the primary button |
White space. White space separates groups, rests the eye and raises perceived quality; crowding makes everything equal and therefore nothing important.
Other tools are balance, rhythm, unity, emphasis, the rule of thirds and the golden ratio (a 960 px layout splits into about 593 px and 367 px).
Worked example. A result portal uses a 12-column grid with a 3-column sidebar for the exam list and a 9-column main area for marks.
The marks table is left-aligned on one strong edge, the heading is the largest item, the Download button is the only filled button, and the space between the filter group and the table is twice the space inside the group.
A student who scans the page in an F-shape finds the title, the exam name and the button in under two seconds.
Conclusion. A grid gives order, scanning patterns tell where to place content and Gestalt principles tell how to group it. Together they let a user understand a page in a glance.
Q2. Explain colour schemes, the 60-30-10 rule and the WCAG contrast test. How does culture affect colour? (10 marks)
Introduction. Colour attracts attention, groups items and carries meaning, but it must also be accessible.
Screens use the additive RGB model (hex #0F766E is R 15, G 118, B 110); designers think in HSL: hue (0 to 360 degrees), saturation and lightness. A tint adds white, a shade adds black and a tone adds grey.
Colour schemes (Fig. 5.3).
| Scheme | How chosen | Effect |
|---|---|---|
| Monochromatic | one hue, different lightness | calm, cohesive |
| Analogous | neighbouring hues (144, 174, 204 degrees) | harmonious |
| Complementary | opposite hues (174 and 354 degrees) | strong contrast; use one as an accent |
| Split-complementary | a hue and the two neighbours of its complement | contrast with less tension |
| Triadic | three hues 120 degrees apart (174, 294, 54) | colourful; needs balance |
The 60-30-10 rule. Use 60 percent neutral (backgrounds), 30 percent secondary colour (surfaces, secondary parts) and 10 percent accent (primary buttons, links). A UI palette also has semantic colours: green success, amber warning, red error, blue information.
WCAG contrast. The contrast ratio is \dfrac{L_1 + 0.05}{L_2 + 0.05}, where L1 is the relative luminance of the lighter colour and L2 of the darker one. Level AA needs at least 4.5 to 1 for normal text and 3 to 1 for large text and for UI components (Fig. 1.3).
Culture. Red means danger but also luck and marriage in Nepal and India; white means purity but also mourning in Nepali culture; green means success; blue means trust.
About 8 percent of men and 0.5 percent of women have colour-vision deficiency, so colour must never be the only signal: add an icon or text.
Worked example. A fee-payment app chooses teal (174 degrees) as the brand colour.
Backgrounds are near-white and grey (60 percent), cards and headers use a pale teal tint (30 percent), and the Pay button is an amber accent (10 percent), which is close to the complement of blue and stands out.
White text on the dark teal passes AA at about 5.5 to 1, and every success or error message carries an icon and a word as well as a colour.
Conclusion. A good palette is small, follows 60-30-10, passes the contrast test and is tested with local users.
Q3. State the rules for font selection and typographic controls for screens. (5 marks)
Typography is the art of arranging type so that text is readable, legible and expressive.
Font selection.
- Use one or two families: for example one sans-serif such as Inter or Poppins for headings and one for body, or one family in several weights.
- Choose legibility first: distinct letters (I, l, 1), a large x-height and open counters, tested on real devices.
- Match the brand mood, check language coverage (a Devanagari font such as Noto Sans Devanagari, Mukta or Hind for Nepali) and licensing, and load few web-font files with
font-display: swap.
Typographic controls (Fig. 5.4).
| Property | Guideline |
|---|---|
| Size | 16 px or more for body text |
| Line height | 1.4 to 1.6 times the size; 1.5 or more for Devanagari |
| Measure | 45 to 75 characters per line (35 to 50 on phones) |
| Alignment | left; avoid justified text and centred paragraphs |
| Weight and case | 400 body, 600 to 700 headings; sentence case |
A modular scale multiplies a base by a ratio: 16 px with 1.25 gives 16, 20, 25, 31.25 and 39.06 px for body, H4, H3, H2 and H1. Use relative units (rem) so users can enlarge text.
Q4. What is visual hierarchy? Explain the principles used to create it and the squint test. (5 marks)
Visual hierarchy orders elements by importance so that the eye notices the most important first and the least important last (Fig. 5.5).
- Size: larger means more important; the amount is bigger than the note.
- Colour: a saturated or warm colour attracts attention; muted colours recede, so one bright accent marks the primary button.
- Contrast: a difference in tone, weight or fill makes an element stand out; the primary button is filled, secondary ones are outlined.
- Alignment: a strong left edge organises content and makes it look related.
- Proximity and white space: closeness groups items; isolation emphasises.
- Texture and elevation: shadows and borders lift a card above its background.
- Time and motion: what appears first is seen first.
Squint test. Blur the design or squint at it: the elements that remain visible have the highest rank. If the remaining elements are not the right ones, change the sizes and colours. Aim for three or four levels of importance only.
Example. On a payment screen, the amount (large), Pay (filled) and the payee (grey, small) should survive the squint test; the fee note should fade away.
Q5. Explain the types of navigation and the navigational models (information structures) with a diagram reference. (10 marks)
Introduction. Navigation helps users know where they are, where they can go and how to get back. Good navigation has consistent placement, labels in the users' words, a highlighted current place and shallow depth (Plate 5.2).
Types of navigation.
| Type | Description | Example |
|---|---|---|
| Global | main links on every page | header menu, bottom tab bar |
| Local | links inside the current section | side menu of a chapter |
| Utility | tools: login, cart, language, search | small links at the top-right |
| Associative | related content | "see also", recommendations |
| Inline | links inside text | "learn more" in a paragraph |
| Supplementary | breadcrumbs, sitemap, footer, pagination | Home > Courses > BCA |
Navigational models (Fig. 5.6).
| Model | Structure | Best for | Weakness |
|---|---|---|---|
| Hub and spoke | a hub links to separate spokes | simple apps, phone home screen | no direct move between spokes |
| Fully connected | every page links to all others | very small sites | n(n - 1) / 2 links: 10 for 5 pages |
| Multilevel tree | home, categories, subcategories, items | large catalogues, documentation | deep trees hide content |
| Stepwise | fixed order 1, 2, 3 | checkout, forms, onboarding | rigid; needs progress and Back |
| Pyramid | sequence with detail pages | tutorials, courses | less flexible than a tree |
| Flat | all pages one click from one menu | small sites | does not scale past about 10 items |
Mobile patterns. The bottom tab bar (three to five destinations), the navigation drawer, gesture navigation and search-first design.
Testing. Card sorting (users group the content) and tree testing (users find items in a text-only tree) show whether the structure matches the users' mental model.
Choosing a model. A phone wallet starts as hub and spoke with a bottom tab bar. The payment itself is stepwise: payee, amount, confirm, receipt. The help centre is a tree with breadcrumbs, because it holds hundreds of articles.
A fully connected structure would be wrong for any of them, since it needs n(n - 1) / 2 links and confuses the user as the site grows.
Example. A college portal uses a global menu (Home, Results, Fees, Help), a local side menu in Results, utility links (Login, Nepali or English), breadcrumbs and a stepwise flow for the fee payment.
Conclusion. Choose the structure to fit the task and the size of the site, and always show the user's location and the way back.
Q6. A page has a 1440 px container, 30 px gutters and 12 columns. Find the column width and the width of boxes spanning 4 and 8 columns. Check with a 960 px grid. (5 marks)
Column width. Column = (container - 11 x gutter) / 12 = (1440 - 11 x 30) / 12 = (1440 - 330) / 12 = 1110 / 12 = 92.5 px.
Spanning n columns. Width = n x column + (n - 1) x gutter.
- 4 columns: 4 x 92.5 + 3 x 30 = 370 + 90 = 460 px.
- 8 columns: 8 x 92.5 + 7 x 30 = 740 + 210 = 950 px.
- Check: 460 + 30 (gutter) + 950 = 1440 px, so the two boxes fill the container.
Check with 960 px and 20 px gutters. Column = (960 - 220) / 12 = 61.67 px. A 3-column box is 3 x 61.67 + 2 x 20 = 225 px, a 9-column box is 9 x 61.67 + 8 x 20 = 715 px, and 225 + 20 + 715 = 960 px (Fig. 5.1).
Comment. The same method works for any container, so developers can compute widths exactly. Boxes that start and end on column edges look aligned. On a phone, the 12 columns collapse to 4 and the boxes stack in one column, as in the responsive breakpoints of Fig. 3.6.