Chapter 7 · Mathematics · 3 questions in the paper · 8 min read
Statistics and Probability
What the syllabus asks for 3
- Measures of location and measures of dispersion
- Correlation and regression
- Basic terms of probability, conditional and compound probability, additive and multiplicative rules, Bayes' theorem, binomial distribution
Statistics and probability carry about 3 questions (our estimate).
The booklet's model question — a lottery with 10 prizes and 25 blanks — shows the usual level: a direct probability, a conditional or Bayes calculation, a binomial, or the mean / standard deviation / regression of a small data set.
All are computed from short formulas; the risk is arithmetic, not concepts.
- Mean, median, mode (and \text{mode}\approx3\,\text{median}-2\,\text{mean}); variance, standard deviation, coefficient of variation.
- Effect of y=ax+b on mean and SD; combined mean.
- Pearson r, rank correlation, regression coefficients and r^2=b_{yx}b_{xy}; lines pass through (\bar x,\bar y).
- Probability rules, conditional probability, independence, Bayes' theorem.
- Binomial: P(r)={}^nC_rp^rq^{n-r}, mean np, variance npq.
7.1 Measures of location and dispersion
Location. Mean \bar x=\frac{\sum x}{n} (grouped: \frac{\sum fx}{\sum f}, or step deviation A+h\frac{\sum fu}{\sum f}). Median: middle value of ordered data (average of the two middle ones if n is even); grouped: L+\dfrac{n/2-F}{f}h.
Mode: the most frequent value; grouped: L+\dfrac{f_1-f_0}{2f_1-f_0-f_2}h. Empirical relation \text{mode}=3\,\text{median}-2\,\text{mean}. Quartiles Q_1,Q_2,Q_3; n-th percentile.
Combined mean of two groups: \dfrac{n_1\bar x_1+n_2\bar x_2}{n_1+n_2}. For y=ax+b: \bar y=a\bar x+b.
Dispersion.
- Range = max - min; quartile deviation \frac{Q_3-Q_1}{2}; mean deviation \frac{\sum|x-\bar x|}{n}.
- Variance \sigma^2=\dfrac{\sum(x-\bar x)^2}{n}=\dfrac{\sum x^2}{n}-\bar x^2; standard deviation \sigma=\sqrt{\sigma^2}.
- For y=ax+b: \sigma_y=|a|\sigma_x (adding a constant does not change the spread).
- Coefficient of variation \text{CV}=\dfrac{\sigma}{\bar x}\times100\%: a smaller CV means a more consistent set.
- The sample variance divides by n-1; the paper's data sets are treated as the whole population unless stated.
Problem. Standard deviation of 2,4,4,4,5,5,7,9.
Solution. Mean 5; deviations squared: 9,1,1,1,0,0,4,16, total 32; variance \frac{32}{8}=4; \sigma=2.
7.2 Correlation and regression
Karl Pearson's coefficient r=\dfrac{\text{cov}(x,y)}{\sigma_x\sigma_y}=\dfrac{n\sum xy-\sum x\sum y}{\sqrt{n\sum x^2-(\sum x)^2}\sqrt{n\sum y^2-(\sum y)^2}}, with -1\le r\le1 (r=\pm1 perfect linear, 0 no linear relation).
Spearman's rank \rho=1-\dfrac{6\sum d^2}{n(n^2-1)}.
Regression lines. y on x: y-\bar y=b_{yx}(x-\bar x) with b_{yx}=r\dfrac{\sigma_y}{\sigma_x}; x on y: x-\bar x=b_{xy}(y-\bar y), b_{xy}=r\dfrac{\sigma_x}{\sigma_y}.
Both lines pass through (\bar x,\bar y), so the means are found by solving the two lines together. b_{yx}b_{xy}=r^2, and b_{yx},b_{xy},r share one sign.
The angle between the lines is \tan\theta=\dfrac{1-r^2}{|r|}\cdot\dfrac{\sigma_x\sigma_y}{\sigma_x^2+\sigma_y^2}.
7.3 Probability: rules, conditional, Bayes, binomial
P(A)=\dfrac{\text{favourable}}{\text{total}} for equally likely outcomes; 0\le P\le1; P(A')=1-P(A). Two dice: 36 outcomes; sum 7 in 6 of them (\frac{1}{6}); sum \ge10 in 6 (\frac{1}{6}). A leap year has 52 weeks and 2 extra days; P(53\text{ Sundays})=\frac{2}{7}.
- Addition: P(A\cup B)=P(A)+P(B)-P(A\cap B); for mutually exclusive events the last term is 0.
- Conditional: P(A|B)=\dfrac{P(A\cap B)}{P(B)}. Multiplication: P(A\cap B)=P(A)P(B|A).
- Independent: P(A\cap B)=P(A)P(B). (Mutually exclusive events with non-zero probabilities are never independent.)
- Total probability P(B)=\sum P(A_i)P(B|A_i). Bayes: P(A_k|B)=\dfrac{P(A_k)P(B|A_k)}{\sum P(A_i)P(B|A_i)}.
- Without replacement: two reds from 3 red, 5 blue: \frac{3}{8}\cdot\frac{2}{7}=\frac{3}{28}.
Binomial distribution
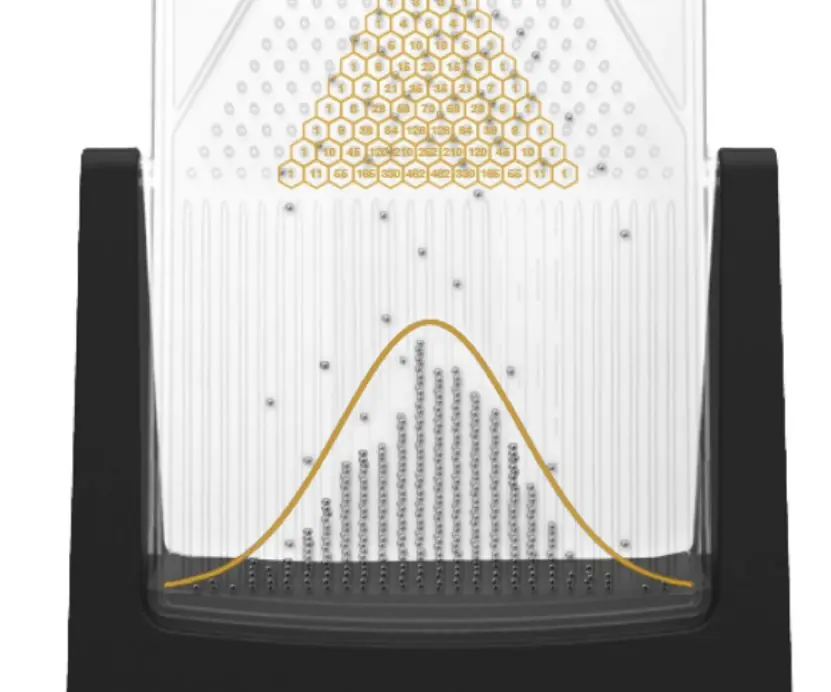
For n independent trials with success probability p (q=1-p): P(X=r)={}^nC_rp^rq^{n-r}; mean np, variance npq, SD \sqrt{npq}; "at least one success" =1-q^n. Expected value E(X)=\sum xP(x). Four tosses of a fair coin, exactly two heads: \frac{6}{16}=\frac{3}{8}.

Formula and fact sheet
| Topic | Result |
|---|---|
| variance | \frac{\sum x^2}{n}-\bar x^2 |
| CV | \frac{\sigma}{\bar x}\times100 |
| y=ax+b | \bar y=a\bar x+b, \sigma_y=|a|\sigma_x |
| r | \frac{\text{cov}}{\sigma_x\sigma_y}; r^2=b_{yx}b_{xy} |
| Spearman | 1-\frac{6\sum d^2}{n(n^2-1)} |
| P(A\cup B) | P(A)+P(B)-P(A\cap B) |
| Bayes | \frac{P(A_k)P(B|A_k)}{\sum P(A_i)P(B|A_i)} |
| binomial | {}^nC_rp^rq^{n-r}; np, npq |
Chapter summary
- Mean, median, mode answer "where"; \sigma and CV answer "how spread out"; spread ignores a shift.
- Both regression lines meet at the means; r^2=b_{yx}b_{xy}.
- For "at least one", use the complement.
- Bayes' theorem reverses a conditional: weigh each cause by prior × likelihood, then normalise.
- Binomial needs a fixed n, independent trials and a constant p.
Practice questions
Set A — Recall (10 questions)
- The mean of 2,4,6,8,10 isa5b6c7d8
- The median of 3,7,5,9,11 isa5b9c7d6.5
- If the variance of a data set is 16, its standard deviation isa4b8c16d2
- If the mean is 50 and the standard deviation 5, the coefficient of variation isa1%b10%c0.1%d25%
- Karl Pearson's coefficient of correlation lies betweena0 and 1b0 and \inftyc-1 and 1d-\infty and \infty
- When two dice are thrown, the probability that the sum is 7 isa1/12b1/9c5/36d1/6
- If P(A)=0.5, P(B)=0.4 and P(A\cap B)=0.2, then P(A\cup B) isa0.7b0.9c0.1d0.2
- The mean of a binomial distribution with n=10, p=0.3 isa7b2.1c3d0.3
- If A and B are independent, P(A)=\frac{1}{2} and P(B)=\frac{1}{3}, then P(A\cap B) isa1/5b2/3c5/6d1/6
- If b_{yx}=0.8 and b_{xy}=0.45, the correlation coefficient r isa0.36b0.6c0.8d0.45
Answers and explanations — Set A
1. (b) — 30/5.
2. (c) — ordered: 3, 5, 7, 9, 11; the middle one is 7.
3. (a) — \sqrt{16}.
4. (b) — \frac{5}{50}\times100.
5. (c) — |r|\le1.
6. (d) — six of 36 outcomes: \frac{1}{6}.
7. (a) — 0.5+0.4-0.2.
8. (c) — np=3 (variance would be 2.1).
9. (d) — multiply: \frac{1}{2}\cdot\frac{1}{3}.
10. (b) — r^2=0.8\times0.45=0.36, r=0.6 (both coefficients positive).
Set B — Understanding (7 questions)
- The mean of 10 observations is 20. Each is multiplied by 3 and then 5 is added. The new mean isa60b65c75d105
- Five observations have mean 4 and another ten have mean 7. The combined mean isa5.5b5c6d6.5
- If the mean of a moderately skewed distribution is 24 and the median is 22, the mode is abouta20b22c24d18
- For n=5 and \sum d^2=10, Spearman's rank correlation isa0.5b0.4c0.6d-0.5
- A bag has 3 red and 5 blue balls. Two are drawn without replacement. The probability that both are red isa9/64b3/28c3/8d1/4
- Machine A makes 60% of the items, 2% of them defective; machine B makes 40%, 5% defective. A defective item is picked. The probability it came from A isa3/5b5/8c3/8d1/4
- A fair coin is tossed 4 times. The probability of exactly two heads isa3/8b1/4c1/2d5/16
Answers and explanations — Set B
1. (b) — 3\times20+5=65.
2. (c) — \frac{5\cdot4+10\cdot7}{15}=6.
3. (d) — 3(22)-2(24)=18.
4. (a) — 1-\frac{6\cdot10}{5\cdot24}=0.5.
5. (b) — \frac{3}{8}\times\frac{2}{7}=\frac{3}{28}. (a) is the with-replacement value.
6. (c) — \frac{0.6\times0.02}{0.6\times0.02+0.4\times0.05}=\frac{0.012}{0.032}=\frac{3}{8}.
7. (a) — ^4C_2/16=\frac{6}{16}.
Set C — Application (6 questions)
- The standard deviation of 2,4,4,4,5,5,7,9 isa4b2c\sqrt{2}d3
- The regression lines are 3x+2y=26 and 6x+y=31. The means (\bar x,\bar y) area(4,7)b(7,4)c(5,6)d(3,8)
- A die is rolled twice. The probability that the sum is at least 10 isa1/12b1/9c1/6d5/36
- A and B are independent, P(A)=0.4 and P(A\cup B)=0.7. Then P(B) isa0.3b0.5c0.75d0.35
- A fair coin is tossed three times. The probability of at least one head isa3/8b1/2c1/8d7/8
- The probability that a randomly chosen leap year has 53 Sundays isa1/7b3/7c2/7d5/7
Answers and explanations — Set C
1. (b) — mean 5, \sum(x-5)^2=32, variance 4.
2. (a) — from y=31-6x: 3x+62-12x=26\Rightarrow x=4, y=7.
3. (c) — (4,6),(5,5),(6,4),(5,6),(6,5),(6,6): \frac{6}{36}.
4. (b) — 0.7=0.4+P(B)-0.4P(B)\Rightarrow0.6P(B)=0.3.
5. (d) — 1-(\frac{1}{2})^3.
6. (c) — 366 days = 52 weeks + 2 days; the pair contains a Sunday in 2 of 7 equally likely cases.
Group D — Model answers for long questions (10 marks each, for deeper revision)
- Find the mean, median, mode, variance and standard deviation of grouped data, and the regression line and correlation of paired data. [10]
- Solve problems using Bayes' theorem and the binomial distribution. [10]
Model answer D1: Dispersion, correlation and regression (10 marks)
Introduction. Averages describe the centre of data and the standard deviation describes its spread. The coefficient of variation is CV=\frac{\sigma}{\bar x}\times100\%.
Raw data: 2,4,4,4,5,5,7,9. Mean =\frac{40}{8}=5; median =4.5; mode =4; the squared deviations are 9,1,1,1,0,0,4,16 (sum 32), so variance =\frac{32}{8}=4, \sigma=2, and CV=40\%.
Grouped data (50 values):
| Class | f | Mid x | fx | fx^2 | Cumulative f |
|---|---|---|---|---|---|
| 0–10 | 5 | 5 | 25 | 125 | 5 |
| 10–20 | 8 | 15 | 120 | 1800 | 13 |
| 20–30 | 15 | 25 | 375 | 9375 | 28 |
| 30–40 | 16 | 35 | 560 | 19600 | 44 |
| 40–50 | 6 | 45 | 270 | 12150 | 50 |
- Mean =\frac{1350}{50}=27.
- Variance =\frac{43050}{50}-27^2=861-729=132, so \sigma=\sqrt{132}=11.49.
- Median: \frac N2=25 falls in 20–30, so median =20+\frac{25-13}{15}\times10=28.
- Mode: modal class 30–40, so mode =30+\frac{16-15}{2(16)-15-6}\times10=30.91.
Correlation and regression. For x=1,2,3,4,5 and y=2,4,5,4,5: \bar x=3, \bar y=4, \sum(x-\bar x)(y-\bar y)=6, \sum(x-\bar x)^2=10, \sum(y-\bar y)^2=6.
- r=\frac{6}{\sqrt{10\times6}}=0.775.
- Slope b_{yx}=\frac{6}{10}=0.6; the line is y-4=0.6(x-3), i.e. y=0.6x+2.2.
- Prediction at x=6: y=5.8.
Conclusion. Spread and relationship are summarised by \sigma, r and the regression line, all computed from simple sums.
Model answer D2: Probability, Bayes' theorem and the binomial distribution (10 marks)
Introduction. P(A\cup B)=P(A)+P(B)-P(A\cap B), P(A\mid B)=\frac{P(A\cap B)}{P(B)}, and independent events satisfy P(A\cap B)=P(A)P(B).
Bayes' theorem. Machines A, B, C make 50\%, 30\% and 20\% of the items, and 1\%, 2\% and 3\% of their items are defective. An item is found defective: which machine made it?
- P(D)=0.5(0.01)+0.3(0.02)+0.2(0.03)=0.005+0.006+0.006=0.017 (total probability).
- P(A\mid D)=\frac{0.005}{0.017}=0.294.
- P(B\mid D)=\frac{0.006}{0.017}=0.353.
- P(C\mid D)=\frac{0.006}{0.017}=0.353.
- The three posterior probabilities add up to 1, and machine A, though it makes half the items, is least likely to be the source.
Binomial distribution. P(X=r)={}^nC_rp^rq^{n-r}, with mean np and variance npq.
| Case | Calculation | Value |
|---|---|---|
| 10 fair-coin tosses, exactly 5 heads | \frac{{}^{10}C_5}{1024}=\frac{252}{1024} | 0.246 |
| At least 8 heads | \frac{45+10+1}{1024} | 0.0547 |
| n=6, p=\frac13: mean | np | 2 |
| n=6, p=\frac13: variance | npq=6\cdot\frac13\cdot\frac23 | \frac43 |
Conclusion. Bayes' theorem reverses a conditional probability using the total probability, and the binomial model describes repeated independent trials.